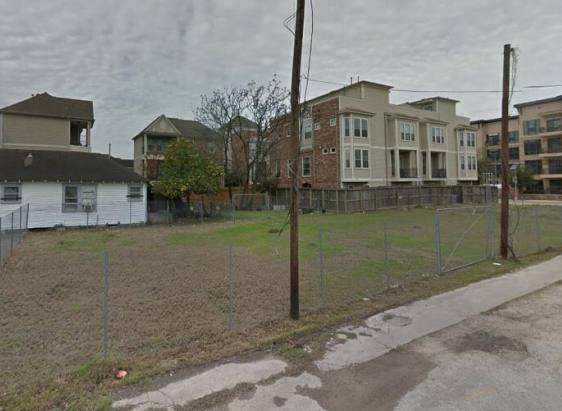
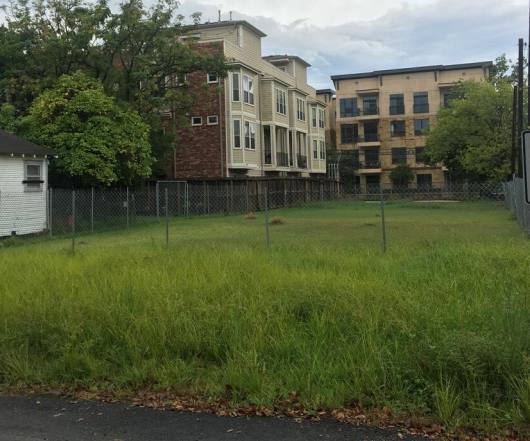
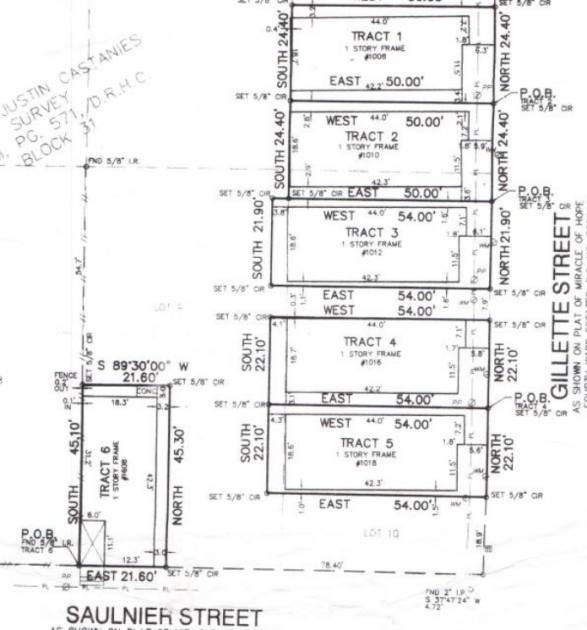
1-Mile | 3-Miles | 5-Miles | ||
---|---|---|---|---|
Total Population | 27,533 | 186,109 | 425,253 | |
Population Median Age | 35 | 37 | 37 | |
Population by Age | 0-9 Yrs | 1732 (6%) | 16297 (8%) | 42563 (10%) |
10-19 Yrs | 601 (2%) | 10604 (5%) | 35895 (8%) | |
20-29 Yrs | 9653 (35%) | 44642 (23%) | 90767 (21%) | |
30-39 Yrs | 7207 (26%) | 42664 (22%) | 84146 (19%) | |
40-49 Yrs | 2890 (10%) | 23525 (12%) | 51596 (12%) | |
50-59 Yrs | 2675 (9%) | 20522 (11%) | 47577 (11%) | |
60-69 Yrs | 1712 (6%) | 16896 (9%) | 40770 (9%) | |
70+ Yrs | 1063 (3%) | 10957 (5%) | 31938 (7%) | |
Median HH Income | $94,258 | $92,481 | $78,622 | |
Total Household Income | < 24K | 2101 (12%) | 13459 (14%) | 34205 (17%) |
25-49K | 1910 (11%) | 11142 (12%) | 30090 (15%) | |
50-74K | 2562 (15%) | 13125 (14%) | 28381 (14%) | |
75-99K | 2024 (12%) | 10231 (11%) | 19986 (10%) | |
100-199K | 4649 (28%) | 22466 (25%) | 42495 (22%) | |
200K+ | 3017 (18%) | 19338 (21%) | 35988 (18%) | |
Highest Education Level | No Diploma | 466 | 11926 | 35305 |
Diploma or GED | 1466 | 15912 | 41888 | |
Some College | 2853 | 17373 | 39983 | |
Assoc. Degree | 866 | 5955 | 13277 | |
Bachelors Degree | 9415 | 49149 | 94521 | |
Higher Degree | 7129 | 42994 | 85657 | |
Total Housing Units | 18,362 | 102,810 | 218,816 | |
--Owner-Occupied | 4,491 | 37,809 | 84,832 | |
--Renter-Occupied | 11,771 | 51,952 | 106,313 | |
Owner-Occupied Values | < 100K | 213 | 1375 | 9101 |
100-199K | 312 | 3344 | 11412 | |
200-299K | 664 | 4654 | 10091 | |
300-399K | 955 | 7463 | 13436 | |
400-499K | 724 | 5617 | 9806 | |
500K+ | 1622 | 15355 | 30985 | |
Total Working Age Population | 25,418 | 163,736 | 362,934 | |
In Work Force | 21,214 | 118,238 | 247,130 | |
Not In Work Force | 4,204 | 45,498 | 115,804 | |
Workforce Employed | 20,691 | 113,097 | 235,341 | |
Workforce Unemployed | 506 | 4,993 | 11,562 | |
Civlian Workforce | 21,198 | 118,090 | 246,903 | |
Military Workforce | 16 | 148 | 227 | |
Total Households | 16,262 | 89,761 | 191,144 | |
Family Households | 4,783 | 35,981 | 88,980 | |
Non-Family Households | 11,479 | 53,781 | 102,164 | |
Married Couple | 3,820 | 28,462 | 65,977 | |
Other Family | 963 | 7,519 | 23,003 | |
Married w/Child | 857 | 8,673 | 22,889 | |
Single Male w/Child | 102 | 796 | 2,464 | |
Single Female w/Child | 293 | 2,364 | 7,613 |
Population Change Last Two Decades - Plus Projection
2000 | % | 2010 | % | 2020 | % | 2030 | |
---|---|---|---|---|---|---|---|
Texas | 20,851,820 | +21 | 25,145,561 | +18 | 29,677,668 | +18 | 34,894,452 |
Harris County | 3,400,578 | +20 | 4,092,459 | +22 | 4,978,845 | +19 | 5,924,750 |
Total Working Age Population:
Total Households:
Total Working Age Population:
Total Households:
Total Working Age Population:
Total Households: