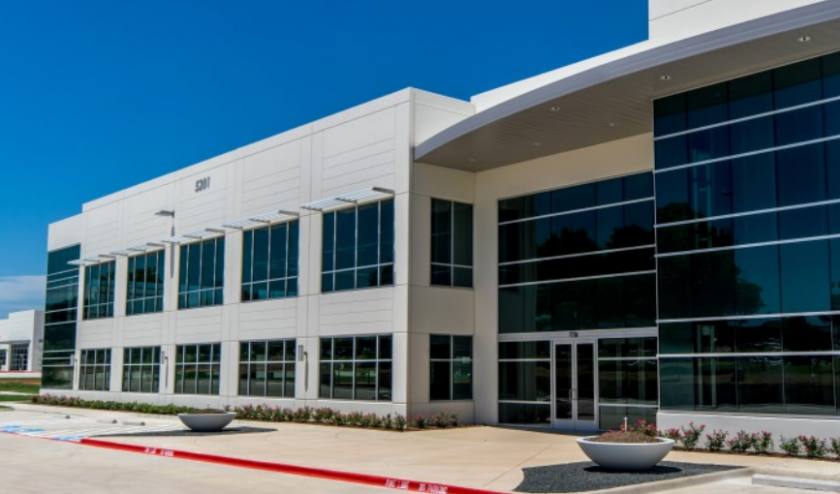
Office Space
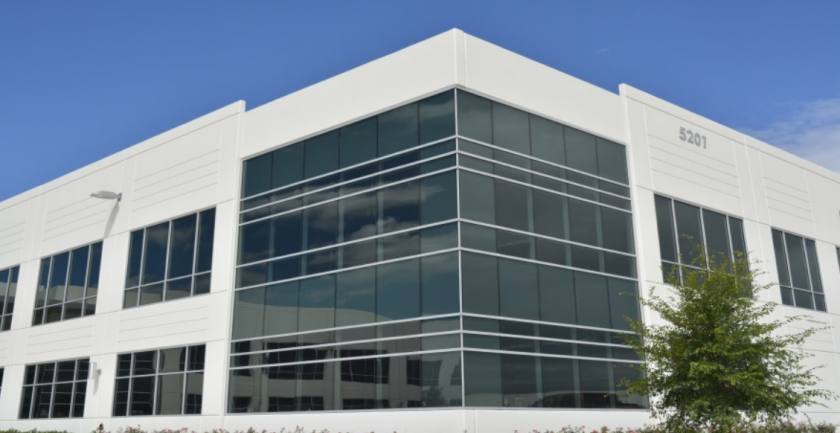
5201 Tennyson Parkway Plano, TX 75024
5201 Tennyson Parkway Plano, TX 75024
Details & Description
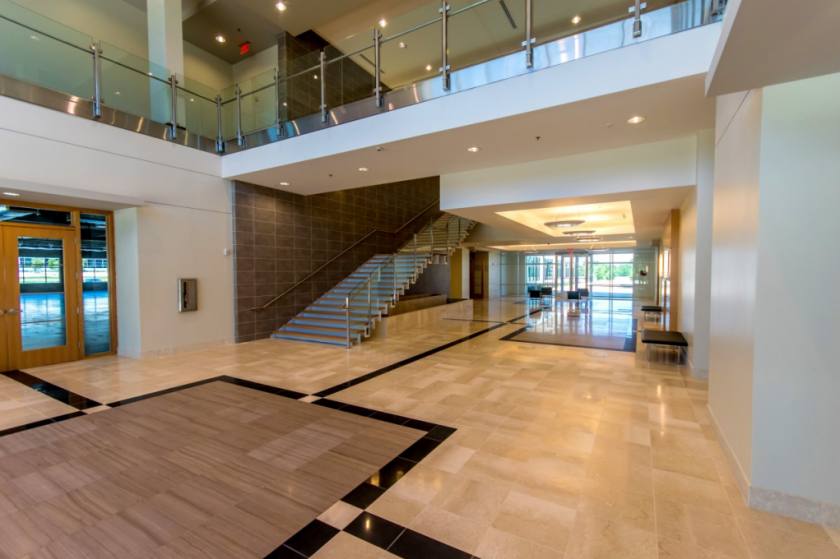
Property Highlights
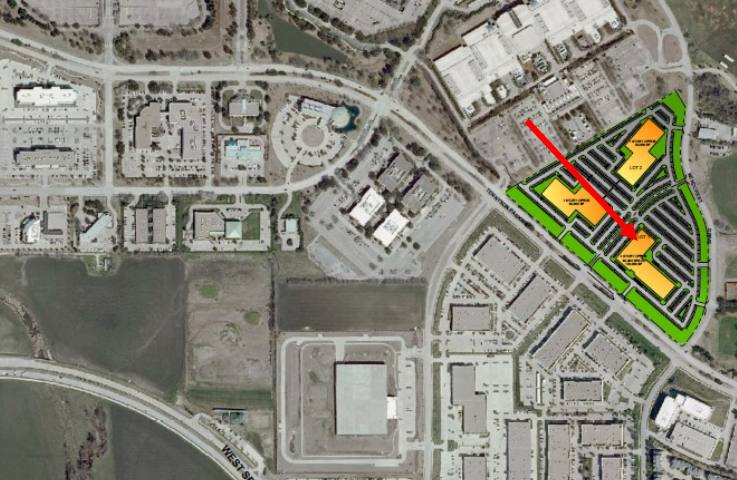
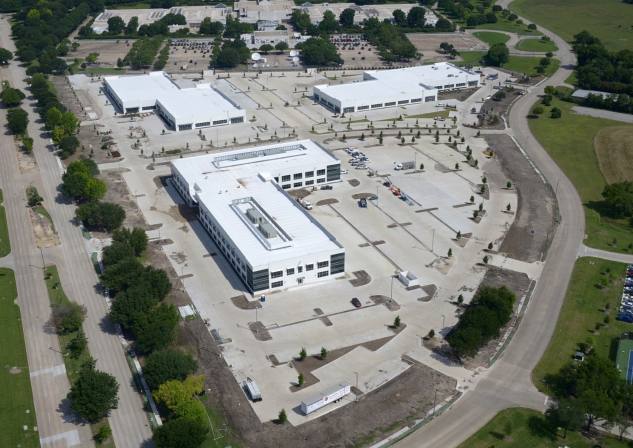
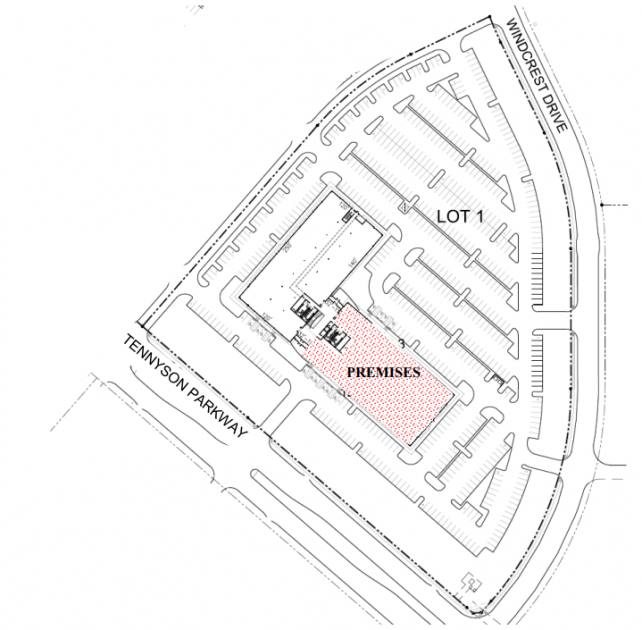
- • Campus design
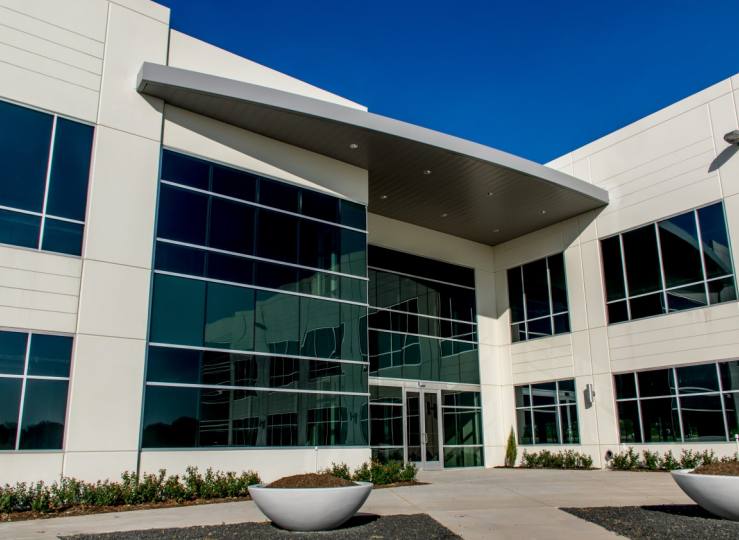
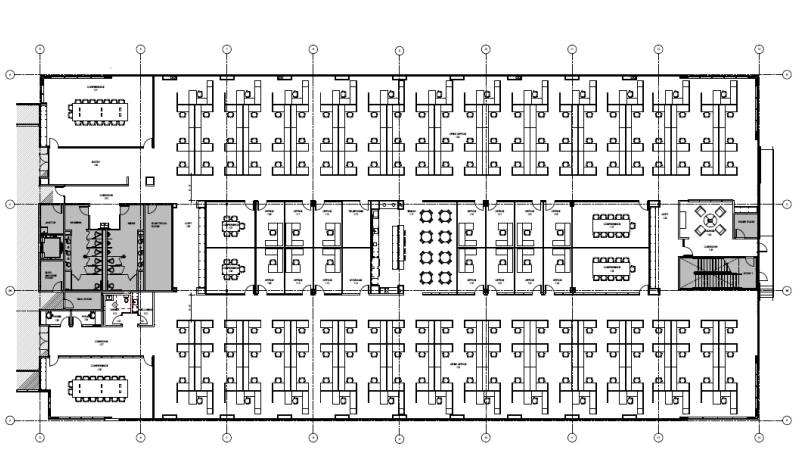
- • 100% office finish
- • Furniture plug & play available
- • Back up generator supports the space
- • 5.5/1,000 surface parking
- • Heavily landscaped
Additional Photos
Listing Agents

Michael Peinado
O: 214-740-3356
mpeinado@lpc.com
O: 214-740-3356
mpeinado@lpc.com

Tom Kuhlmann
O: 214-740-3363
tkuhlmann@lpc.com
O: 214-740-3363
tkuhlmann@lpc.com
While we strive to provide the most accurate information, all listing information, and demographic data, is provided by third-parties. As such, MyEListing will not be responsible for the accuracy of the information. It is strongly recommended that you verify all information with the listing agent, and any relevant agencies, prior to making any decisions.