Office Space
4300 Amon Carter Boulevard Fort Worth, TX 76155
4300 Amon Carter Boulevard Fort Worth, TX 76155
Details & Description
Property Highlights
- • Fully Sprinklered
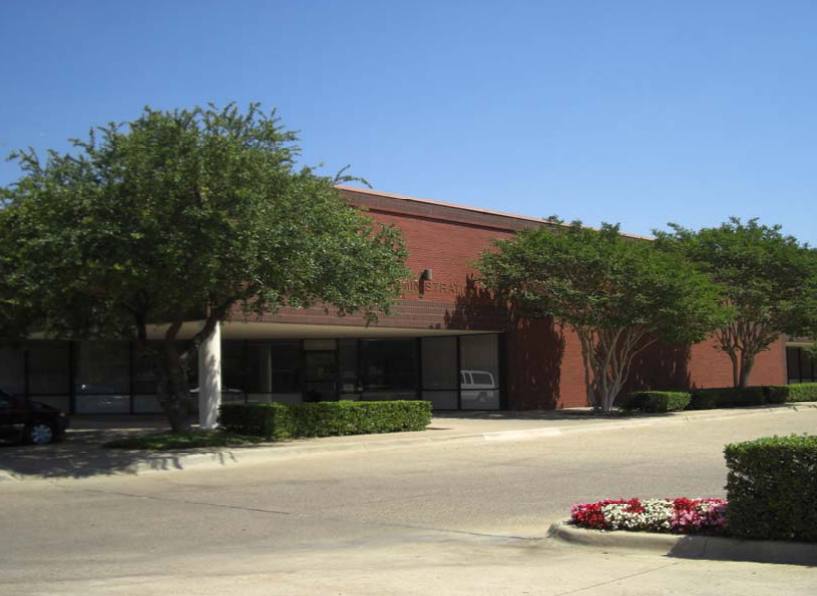
- • Heavily landscaped
- • Tenant maintains 24 hour control of the space
- • No common area building factor
- • Close proximity to DFW Airport
- • Centrally located to the DFW metroplex
Listing Agents

Michael Peinado
O: 214-740-3356
mpeinado@lpc.com
O: 214-740-3356
mpeinado@lpc.com

Tom Kuhlmann
O: 214-740-3363
tkuhlmann@lpc.com
O: 214-740-3363
tkuhlmann@lpc.com
While we strive to provide the most accurate information, all listing information, and demographic data, is provided by third-parties. As such, MyEListing will not be responsible for the accuracy of the information. It is strongly recommended that you verify all information with the listing agent, and any relevant agencies, prior to making any decisions.