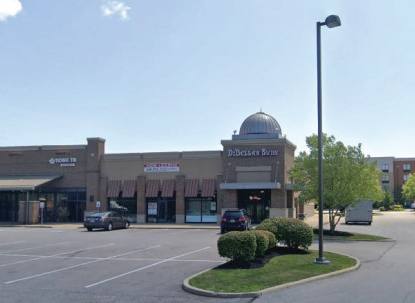
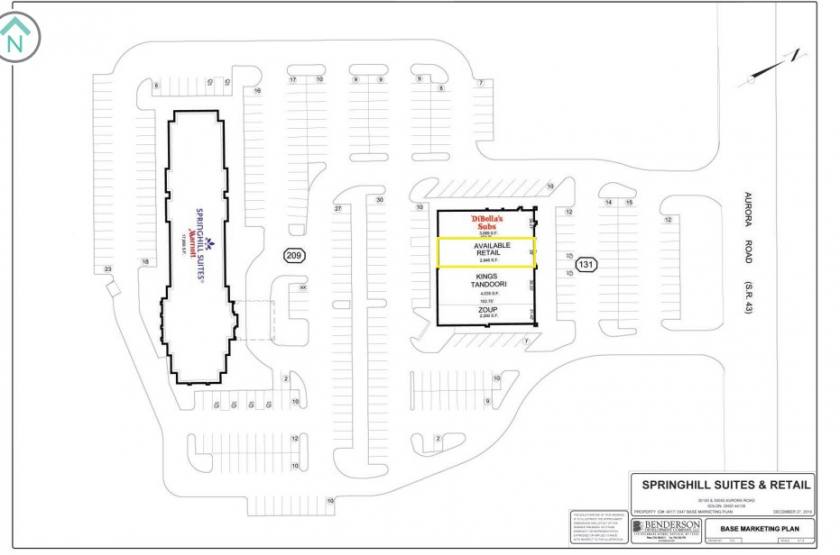
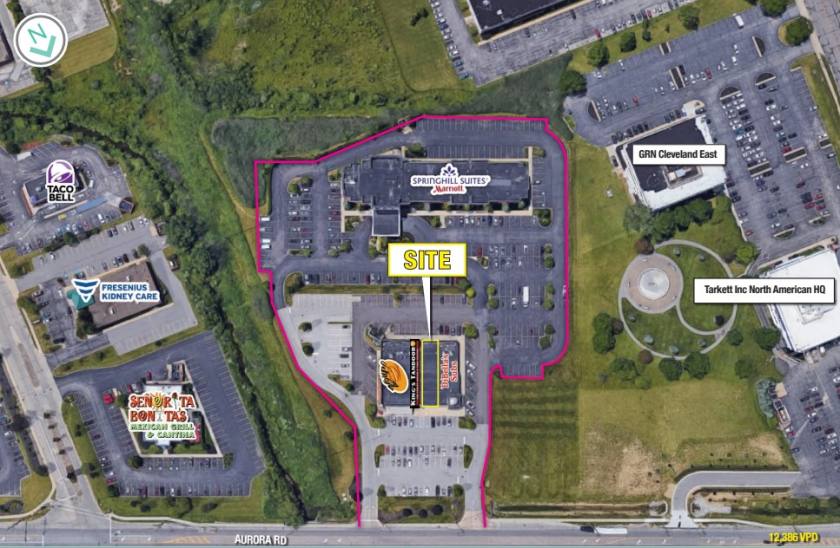
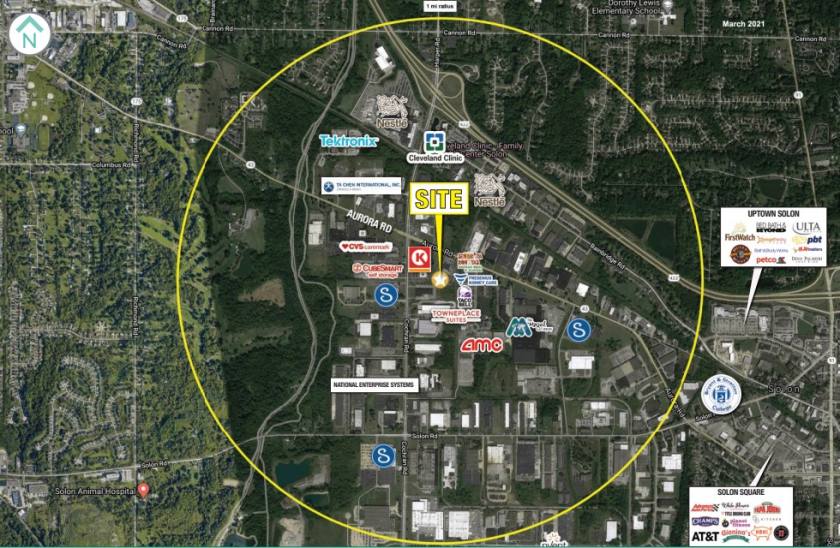
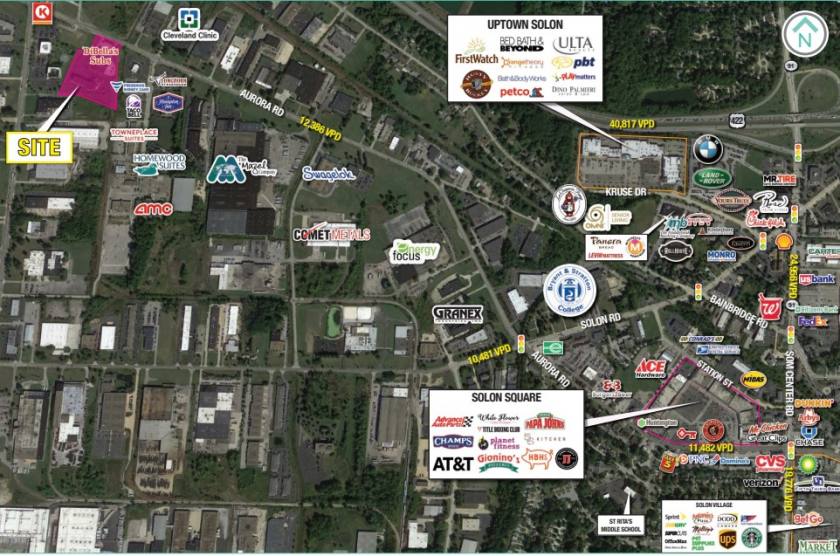
1-Mile | 3-Miles | 5-Miles | ||
---|---|---|---|---|
Total Population | 1,499 | 34,182 | 106,191 | |
Population Median Age | 43 | 42 | 42 | |
Population by Age | 0-9 Yrs | 139 (9%) | 3677 (10%) | 12297 (11%) |
10-19 Yrs | 239 (15%) | 4298 (12%) | 13384 (12%) | |
20-29 Yrs | 78 (5%) | 3129 (9%) | 10312 (9%) | |
30-39 Yrs | 140 (9%) | 4149 (12%) | 12471 (11%) | |
40-49 Yrs | 250 (16%) | 4502 (13%) | 13209 (12%) | |
50-59 Yrs | 236 (15%) | 4905 (14%) | 14922 (14%) | |
60-69 Yrs | 219 (14%) | 5166 (15%) | 15725 (14%) | |
70+ Yrs | 197 (13%) | 4356 (12%) | 13869 (13%) | |
Median HH Income | $113,149 | $69,482 | $63,733 | |
Total Household Income | < 24K | 96 (17%) | 2504 (16%) | 7865 (17%) |
25-49K | 44 (8%) | 2868 (19%) | 10047 (22%) | |
50-74K | 61 (11%) | 2541 (17%) | 7957 (17%) | |
75-99K | 46 (8%) | 1780 (12%) | 5072 (11%) | |
100-199K | 180 (32%) | 3274 (22%) | 9474 (20%) | |
200K+ | 122 (22%) | 1834 (12%) | 5083 (11%) | |
Highest Education Level | No Diploma | 25 | 1451 | 4102 |
Diploma or GED | 151 | 5169 | 19068 | |
Some College | 163 | 5122 | 15804 | |
Assoc. Degree | 81 | 1994 | 6471 | |
Bachelors Degree | 376 | 5492 | 16505 | |
Higher Degree | 260 | 5187 | 13477 | |
Total Housing Units | 558 | 15,697 | 48,978 | |
--Owner-Occupied | 485 | 9,796 | 29,844 | |
--Renter-Occupied | 63 | 5,006 | 15,654 | |
Owner-Occupied Values | < 100K | 13 | 1539 | 6870 |
100-199K | 60 | 2917 | 8255 | |
200-299K | 230 | 2303 | 6162 | |
300-399K | 50 | 1113 | 3373 | |
400-499K | 35 | 848 | 2189 | |
500K+ | 97 | 1076 | 2996 | |
Total Working Age Population | 1,209 | 27,762 | 85,471 | |
In Work Force | 768 | 18,132 | 55,254 | |
Not In Work Force | 441 | 9,631 | 30,218 | |
Workforce Employed | 746 | 17,293 | 52,451 | |
Workforce Unemployed | 16 | 826 | 2,780 | |
Civlian Workforce | 762 | 18,119 | 55,231 | |
Military Workforce | 6 | 13 | 22 | |
Total Households | 548 | 14,802 | 45,498 | |
Family Households | 403 | 9,058 | 28,072 | |
Non-Family Households | 145 | 5,744 | 17,426 | |
Married Couple | 379 | 6,460 | 18,970 | |
Other Family | 25 | 2,598 | 9,102 | |
Married w/Child | 163 | 2,493 | 6,942 | |
Single Male w/Child | 7 | 260 | 962 | |
Single Female w/Child | 1 | 1,007 | 3,699 |
Population Change Last Two Decades - Plus Projection
2000 | % | 2010 | % | 2020 | % | 2030 | |
---|---|---|---|---|---|---|---|
Ohio | 11,353,140 | +2 | 11,536,504 | 0 | 11,574,870 | 0 | 11,615,100 |
Geauga County | 90,895 | +3 | 93,389 | 0 | 93,510 | +2 | 94,930 |
Summit County | 542,899 | 0 | 541,781 | -1 | 534,150 | -1 | 528,990 |
Cuyahoga County | 1,393,978 | -8 | 1,280,122 | -6 | 1,209,550 | -5 | 1,154,210 |
Total Working Age Population:
Total Households:
Total Working Age Population:
Total Households:
Total Working Age Population:
Total Households: