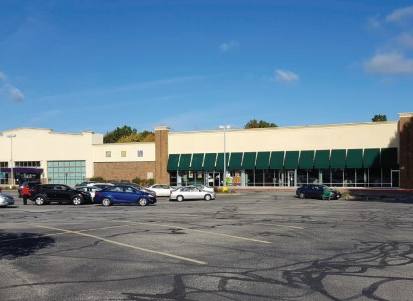
Retail Space
26518 Lorain Road North Olmsted, OH 44070
26518 Lorain Road North Olmsted, OH 44070
Details & Description
Property Highlights
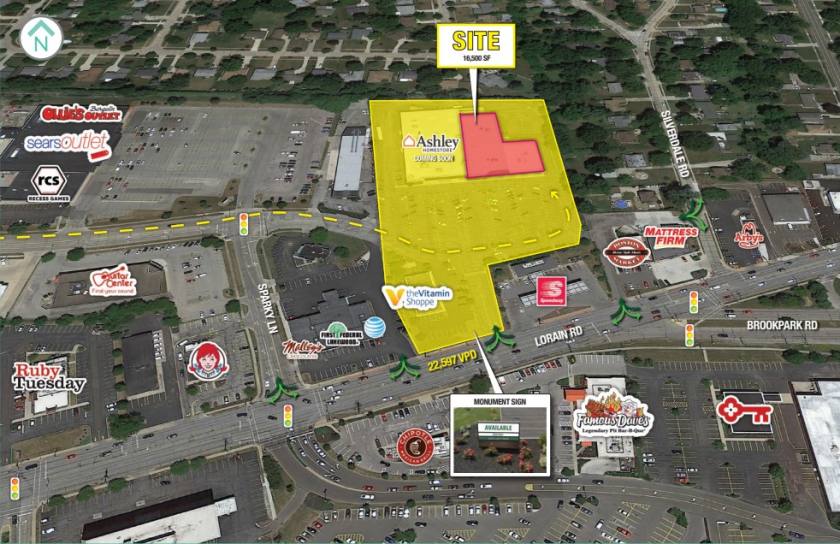
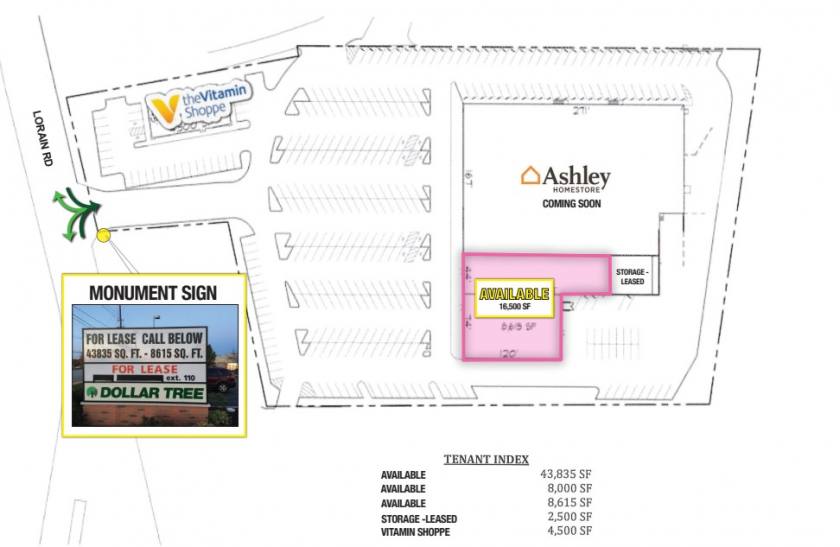
- • Join Ashley Homestore (Coming Soon)
- • Monument Sign Available
- • Co-tenants: Vitamin Shoppe
- • Cross access to traffic light
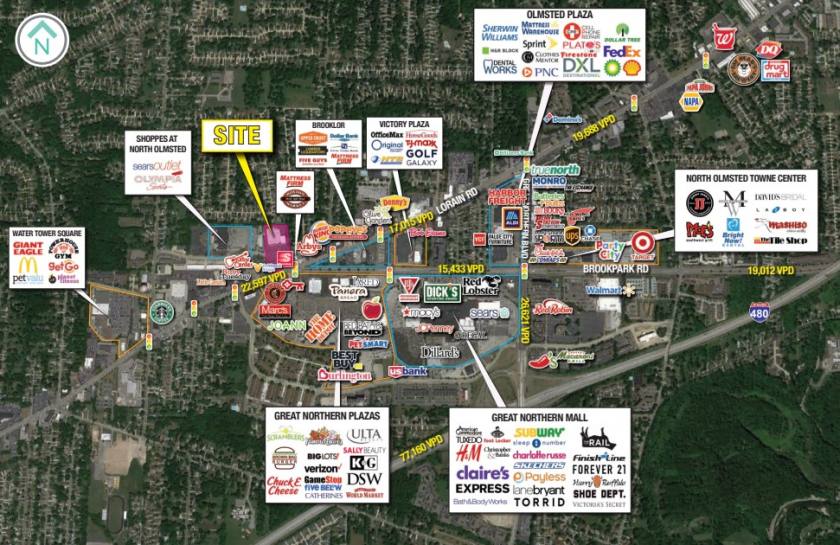
- • Located across from the Great Northern Mall
Additional Photos
Listing Agents

Matt Wilson
M: 216-470-8200
mwilson@anchorretail.com
M: 216-470-8200
mwilson@anchorretail.com
While we strive to provide the most accurate information, all listing information, and demographic data, is provided by third-parties. As such, MyEListing will not be responsible for the accuracy of the information. It is strongly recommended that you verify all information with the listing agent, and any relevant agencies, prior to making any decisions.


