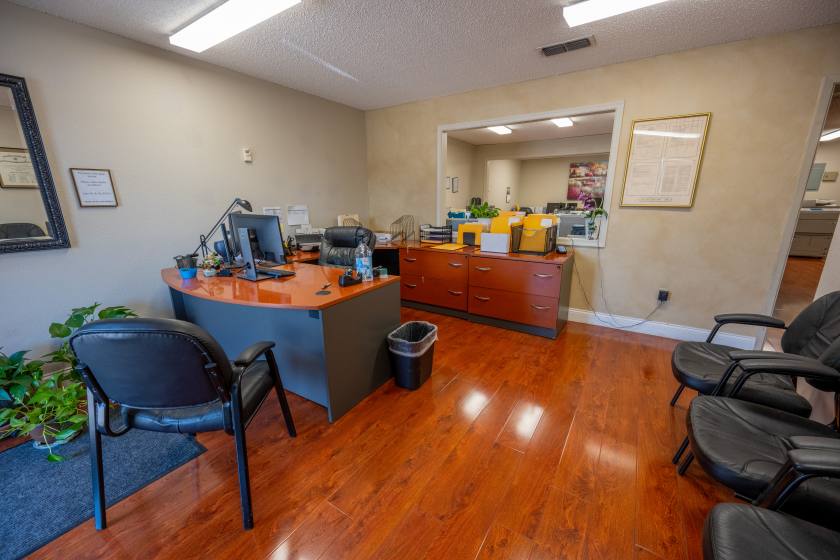
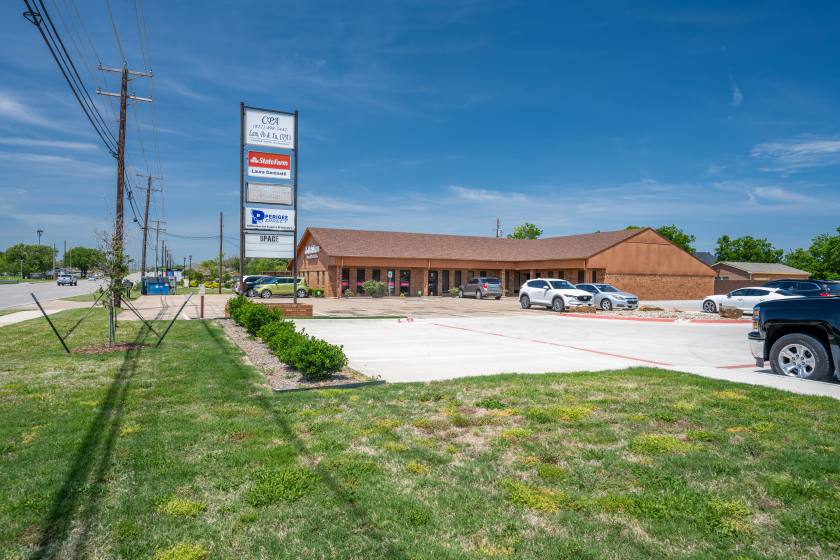
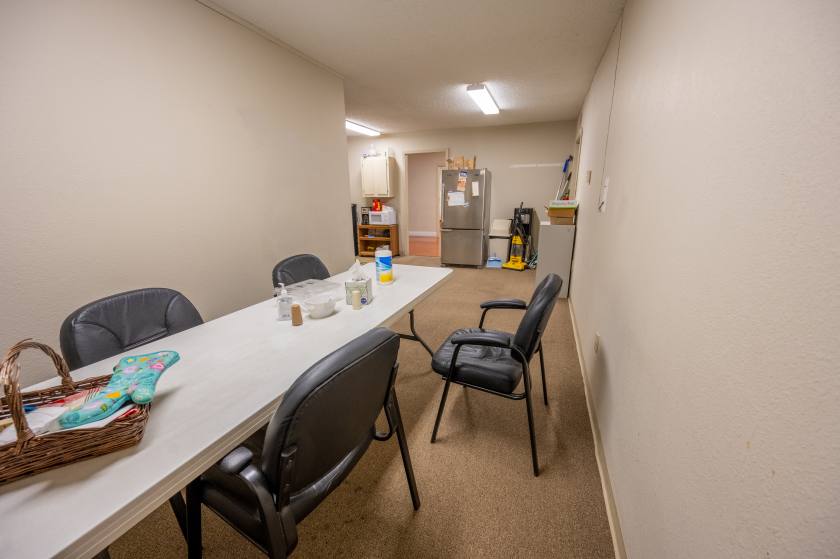
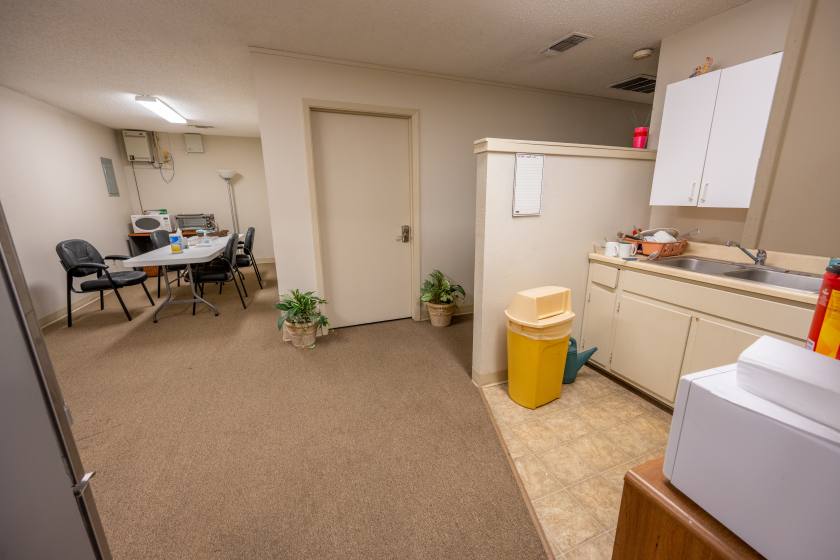
Office Space
7510 Davis Boulevard North Richland Hills, TX 76182
7510 Davis Boulevard North Richland Hills, TX 76182

Details & Description
Property Highlights
- • Investment or Owner/User Opportunity
- • 5,303 SF Building with Five (5) Suites
- • Main Frontage on Davis Blvd
- • High Traffic Area
- • Easy Access to Loop 820 & Hwy 183
- • Great Amenities Within Close Proximity
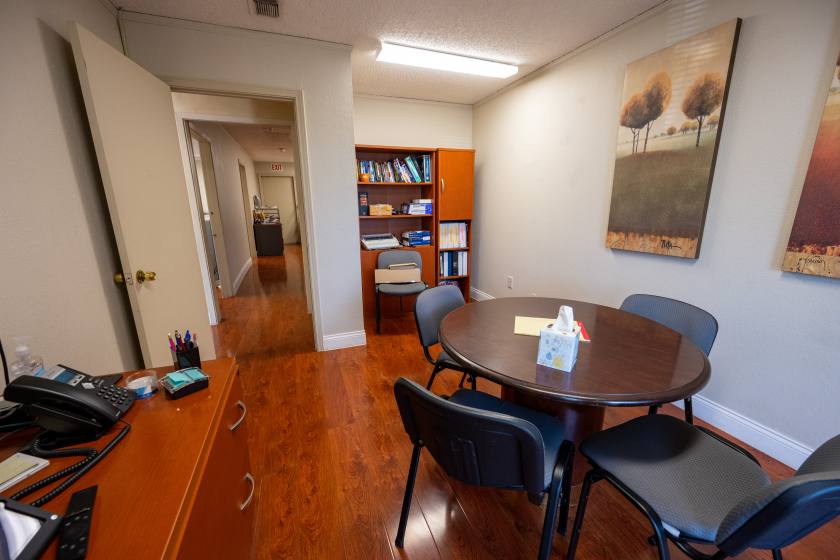
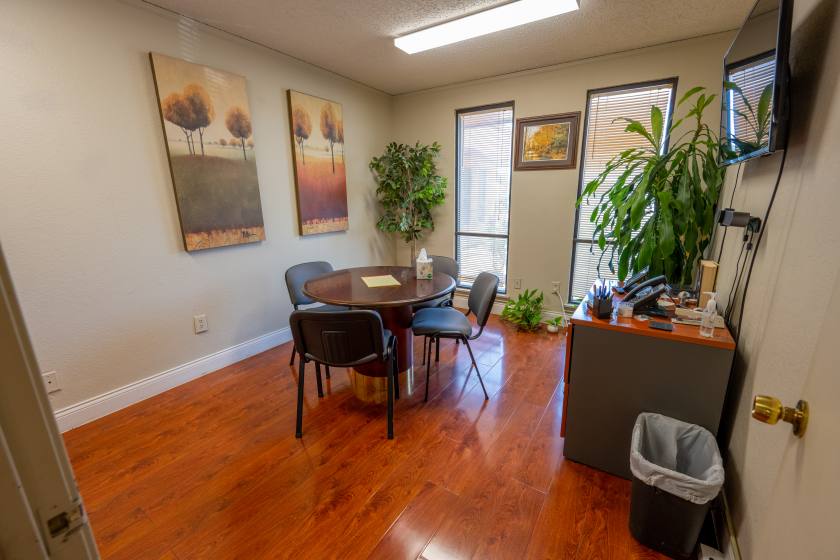
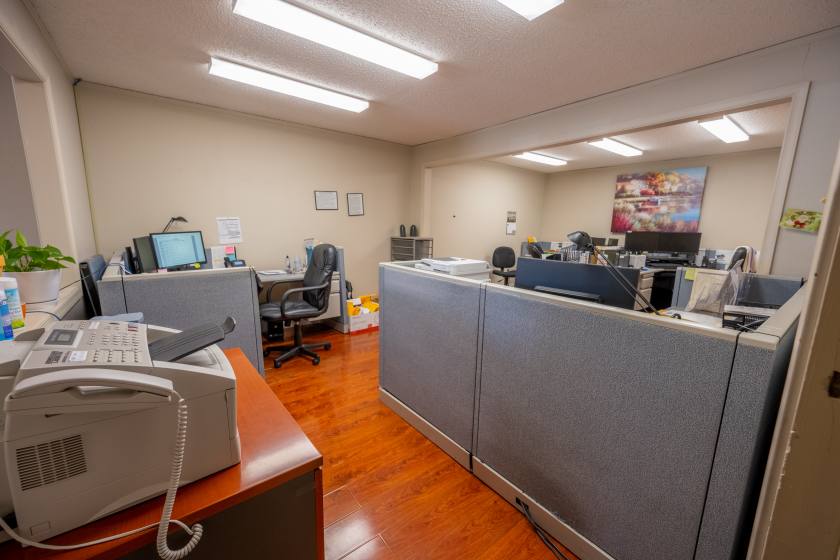
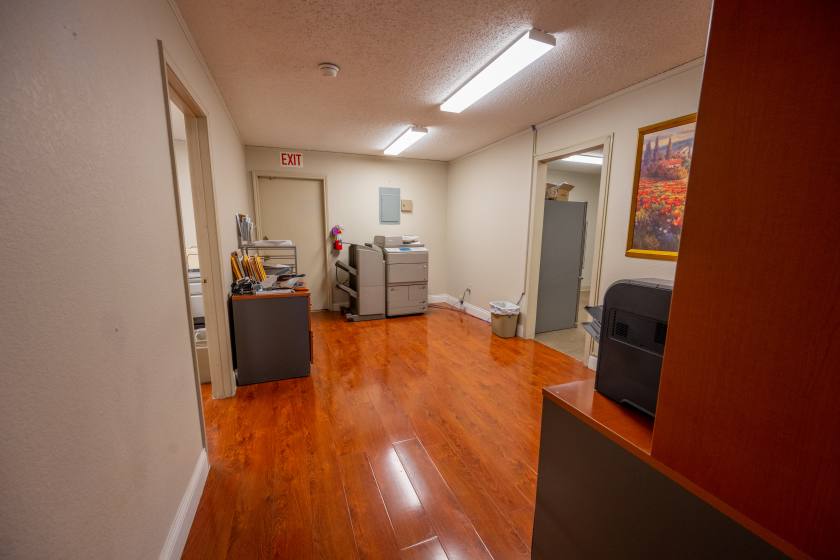
Additional Photos
Listing Agents

David Dunn
O: 817-640-9964
M: 817-829-2828
david.dunn@svn.com
O: 817-640-9964
M: 817-829-2828
david.dunn@svn.com
While we strive to provide the most accurate information, all listing information, and demographic data, is provided by third-parties. As such, MyEListing will not be responsible for the accuracy of the information. It is strongly recommended that you verify all information with the listing agent, and any relevant agencies, prior to making any decisions.