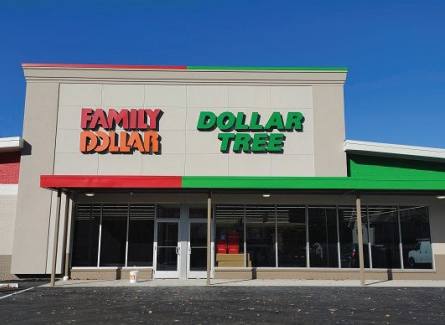
Retail Space
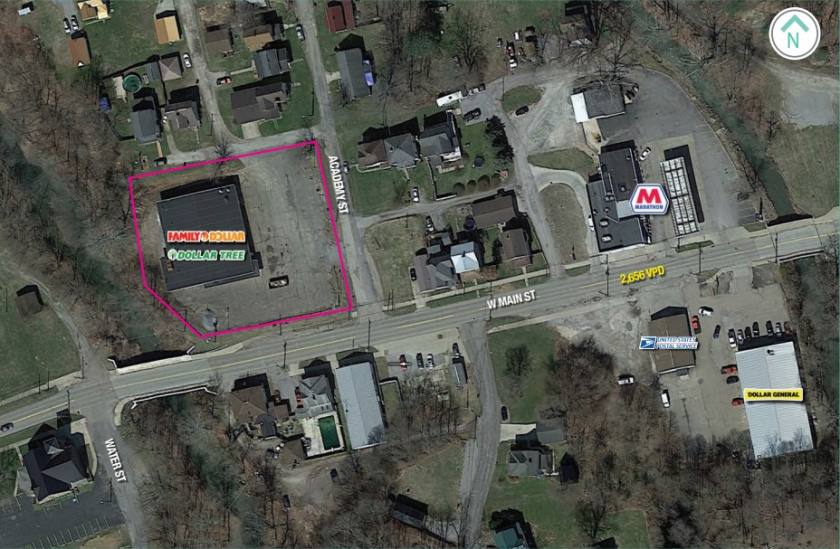
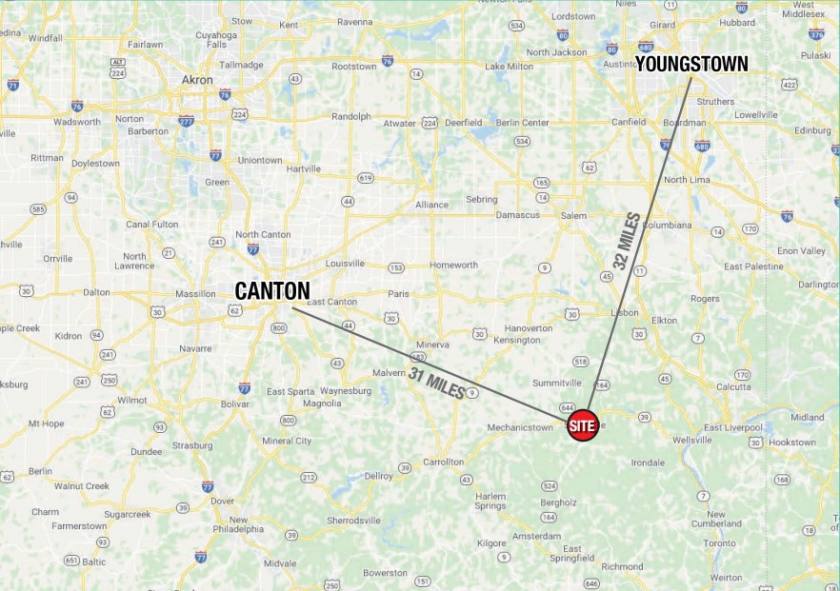
60 West Main Street Salineville, OH 43945
60 West Main Street Salineville, OH 43945
Details & Description
Property Highlights
- • Investment Property
- • 10-yr NN lease, lease expires 2/28/32
- • CAM: $1.00 psf in Year 1, 5% annual cap
- • Brand new HVAC system (four units)
- • Brand new parking lot
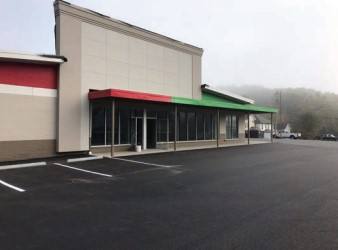
Additional Photos

Listing Agents

Chris McFarland
O: 216-342-2578
M: 216-338-3054
cmcfarland@anchorretail.com
O: 216-342-2578
M: 216-338-3054
cmcfarland@anchorretail.com

Matt Wilson
M: 216-470-8200
mwilson@anchorretail.com
M: 216-470-8200
mwilson@anchorretail.com

Tori Nook
O: 216-342-2550
M: 216-269-5624
tnook@anchorretail.com
O: 216-342-2550
M: 216-269-5624
tnook@anchorretail.com
While we strive to provide the most accurate information, all listing information, and demographic data, is provided by third-parties. As such, MyEListing will not be responsible for the accuracy of the information. It is strongly recommended that you verify all information with the listing agent, and any relevant agencies, prior to making any decisions.


