Industrial Properties
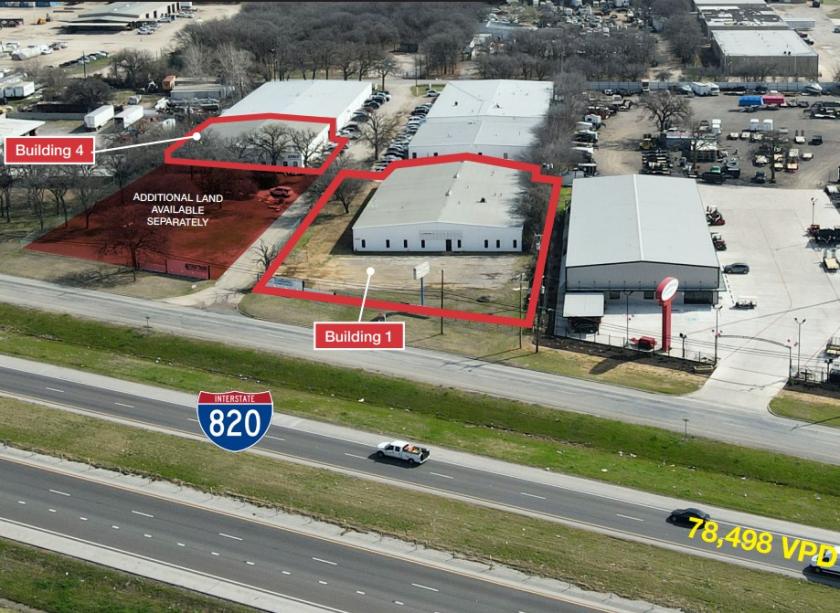
3351 East Loop 820 South Fort Worth, TX 76119
3351 East Loop 820 South Fort Worth, TX 76119
Details & Description
Property Highlights
- • Renovations Underway
- • HVAC Warehouse
- • Sprinklered
- • 0.75 Acre Adjacent Lot Available Separately
- • Heavy 3-Phase Power
Listing Agents

Todd Hubbard
NAI Robert Lynn
O: 817-872-3901
M: 817-501-2012
thubbard@nairl.com
NAI Robert Lynn
O: 817-872-3901
M: 817-501-2012
thubbard@nairl.com

Joe McLiney
O: 817-872-3914
M: 816-718-4233
jmcliney@nairl.com
O: 817-872-3914
M: 816-718-4233
jmcliney@nairl.com
While we strive to provide the most accurate information, all listing information, and demographic data, is provided by third-parties. As such, MyEListing will not be responsible for the accuracy of the information. It is strongly recommended that you verify all information with the listing agent, and any relevant agencies, prior to making any decisions.


