Specialty Real Estate
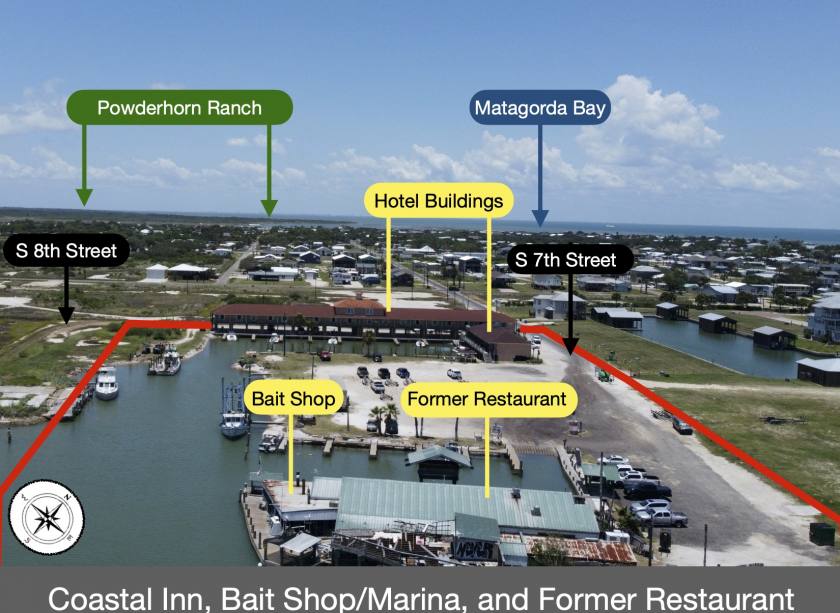
704 7th Street Port OConnor, TX 77982
704 7th Street Port OConnor, TX 77982
Details & Description
Property Highlights
- • Located in a 2022 Texas Opportunity Zone
- • Frontage on Seventh St and Commerce St
- • 52 existing boat slips
- • Turn-Key Coastal Inn
Listing Agents

Spencer Collins
O: 512-536-7829
M: 512-789-0909
spence@matexas.com
O: 512-536-7829
M: 512-789-0909
spence@matexas.com
While we strive to provide the most accurate information, all listing information, and demographic data, is provided by third-parties. As such, MyEListing will not be responsible for the accuracy of the information. It is strongly recommended that you verify all information with the listing agent, and any relevant agencies, prior to making any decisions.

