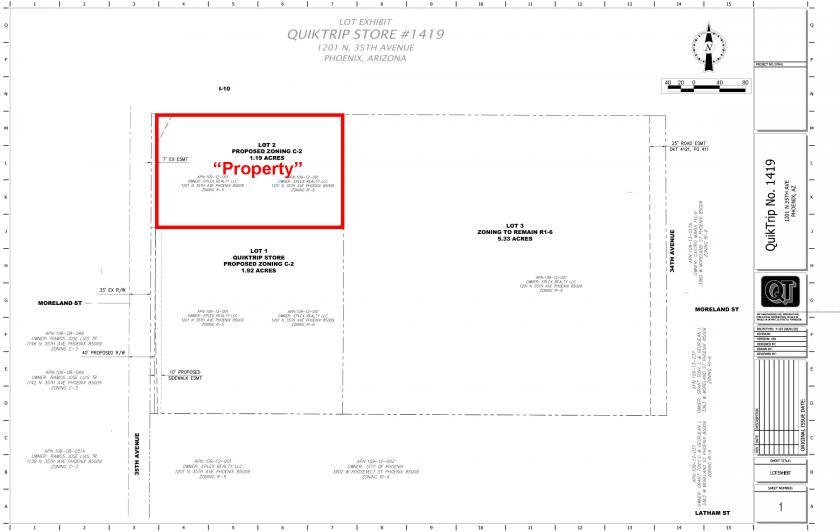
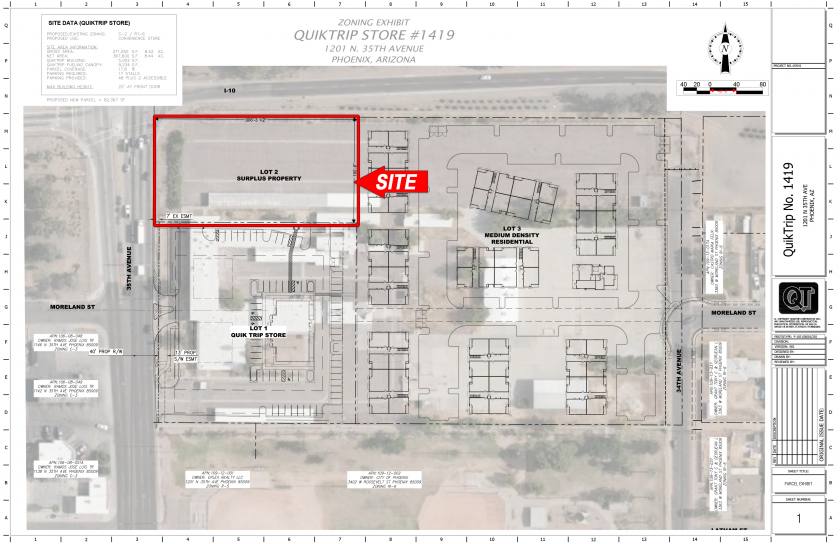
1-Mile | 3-Miles | 5-Miles | ||
---|---|---|---|---|
Total Population | 27,026 | 144,330 | 407,594 | |
Population Median Age | 30 | 32 | 32 | |
Population by Age | 0-9 Yrs | 5117 (18%) | 23068 (15%) | 64886 (15%) |
10-19 Yrs | 4850 (17%) | 25740 (17%) | 69441 (17%) | |
20-29 Yrs | 5176 (19%) | 26499 (18%) | 71265 (17%) | |
30-39 Yrs | 3929 (14%) | 19643 (13%) | 61124 (14%) | |
40-49 Yrs | 2779 (10%) | 18962 (13%) | 53050 (13%) | |
50-59 Yrs | 2600 (9%) | 14913 (10%) | 40925 (10%) | |
60-69 Yrs | 1614 (5%) | 9113 (6%) | 27920 (6%) | |
70+ Yrs | 961 (3%) | 6392 (4%) | 18983 (4%) | |
Median HH Income | $41,195 | $42,667 | $45,272 | |
Total Household Income | < 24K | 1715 (25%) | 10389 (25%) | 30734 (24%) |
25-49K | 2609 (38%) | 13343 (32%) | 37208 (30%) | |
50-74K | 1150 (16%) | 8052 (19%) | 24527 (19%) | |
75-99K | 490 (7%) | 3963 (9%) | 13366 (10%) | |
100-199K | 834 (12%) | 4291 (10%) | 14442 (11%) | |
200K+ | 42 (0%) | 504 (1%) | 3121 (2%) | |
Highest Education Level | No Diploma | 6564 | 33741 | 78933 |
Diploma or GED | 4519 | 24113 | 66158 | |
Some College | 2033 | 13721 | 44039 | |
Assoc. Degree | 506 | 3855 | 14023 | |
Bachelors Degree | 436 | 5014 | 23812 | |
Higher Degree | 127 | 2251 | 12002 | |
Total Housing Units | 7,286 | 43,613 | 134,567 | |
--Owner-Occupied | 3,076 | 17,760 | 54,089 | |
--Renter-Occupied | 3,764 | 22,782 | 69,308 | |
Owner-Occupied Values | < 100K | 1042 | 3796 | 9664 |
100-199K | 1463 | 8879 | 24043 | |
200-299K | 501 | 3304 | 13233 | |
300-399K | 30 | 797 | 3570 | |
400-499K | 1 | 343 | 1430 | |
500K+ | 38 | 641 | 2149 | |
Total Working Age Population | 19,166 | 106,030 | 302,629 | |
In Work Force | 12,189 | 66,322 | 197,225 | |
Not In Work Force | 6,976 | 39,708 | 105,403 | |
Workforce Employed | 11,466 | 61,533 | 184,109 | |
Workforce Unemployed | 694 | 4,725 | 12,933 | |
Civlian Workforce | 12,160 | 66,258 | 197,042 | |
Military Workforce | 29 | 64 | 183 | |
Total Households | 6,840 | 40,542 | 123,398 | |
Family Households | 5,389 | 28,523 | 79,461 | |
Non-Family Households | 1,450 | 12,019 | 43,937 | |
Married Couple | 2,893 | 16,423 | 44,355 | |
Other Family | 2,497 | 12,100 | 35,105 | |
Married w/Child | 1,634 | 9,613 | 24,238 | |
Single Male w/Child | 594 | 2,120 | 5,943 | |
Single Female w/Child | 976 | 5,482 | 15,087 |
Population Change Last Two Decades - Plus Projection
2000 | % | 2010 | % | 2020 | % | 2030 | |
---|---|---|---|---|---|---|---|
Arizona | 5,130,632 | +25 | 6,392,017 | +14 | 7,286,100 | +14 | 8,284,900 |
Maricopa County | 3,072,149 | +24 | 3,817,117 | +16 | 4,436,900 | +15 | 5,107,700 |
Total Working Age Population:
Total Households:
Total Working Age Population:
Total Households:
Total Working Age Population:
Total Households: