Commercial Land
10699 W Lower Buckeye Rd Tolleson, AZ 85353
10699 W Lower Buckeye Rd Tolleson, AZ 85353
Details & Description
Property Highlights
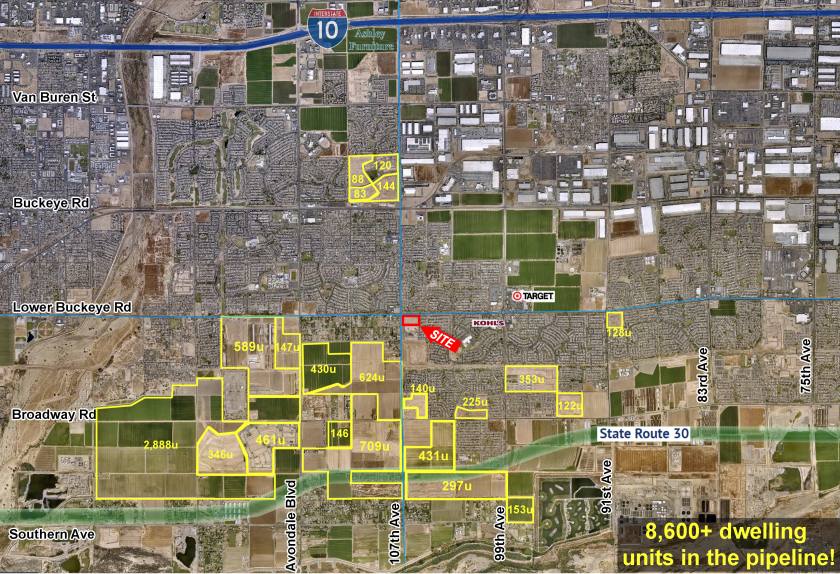
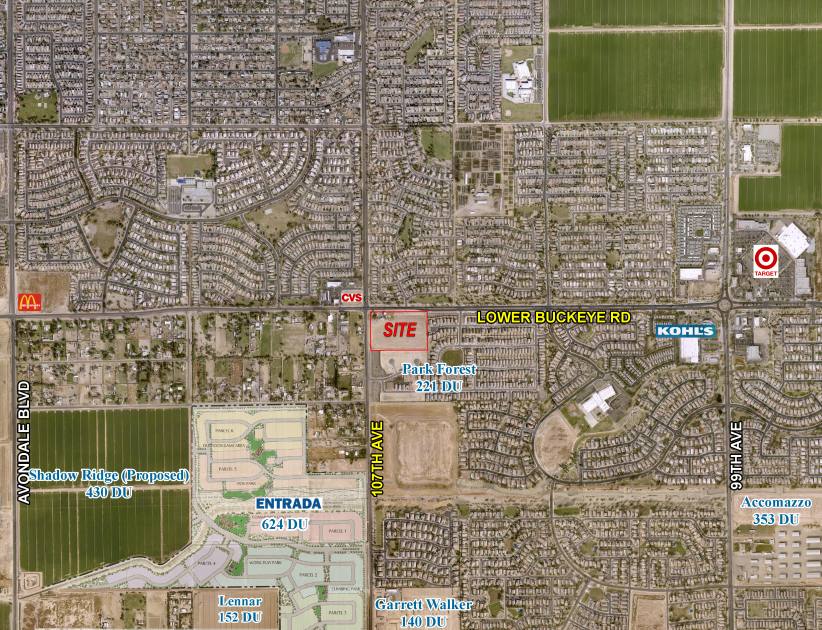
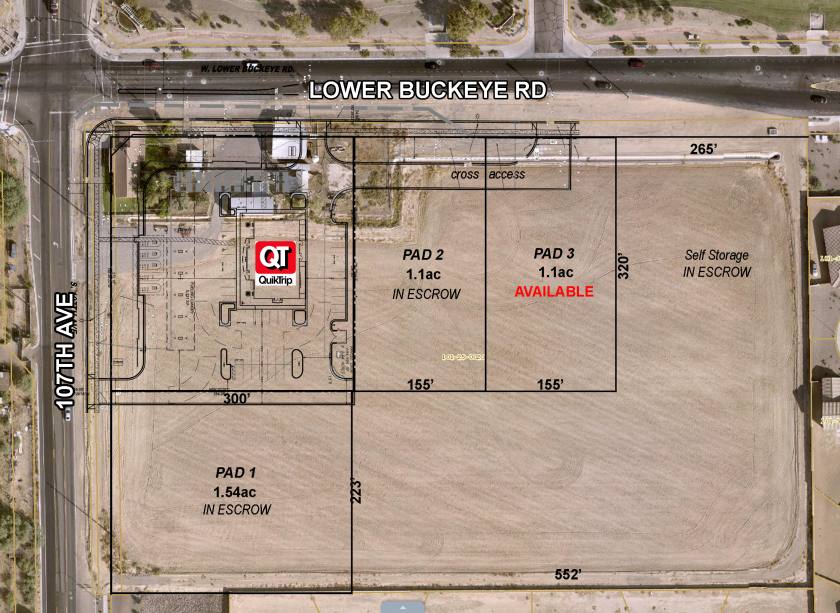
• Join QT in a rapidly growing trade area
• Join QT in a rapidly growing trade area
Listing Agents

Steve Parsons
O: 480-947-4900
sparsons@empirecommercial.com
O: 480-947-4900
sparsons@empirecommercial.com
While we strive to provide the most accurate information, all listing information, and demographic data, is provided by third-parties. As such, MyEListing will not be responsible for the accuracy of the information. It is strongly recommended that you verify all information with the listing agent, and any relevant agencies, prior to making any decisions.