Industrial Properties
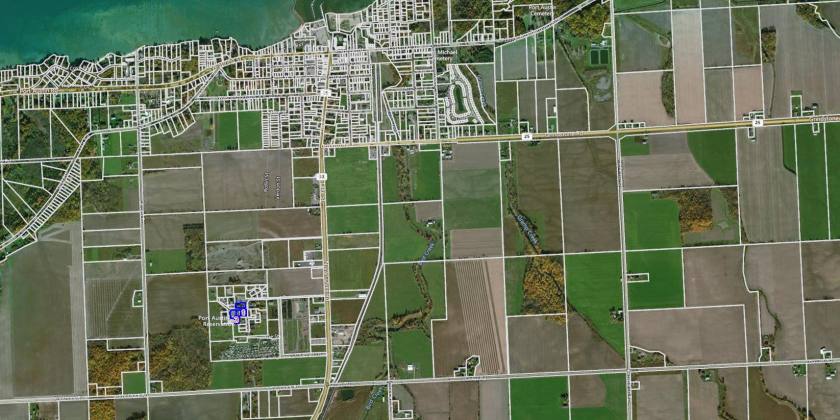
401 Starboard Drive Port Austin, MI 48467
401 Starboard Drive Port Austin, MI 48467
Details & Description
Property Highlights
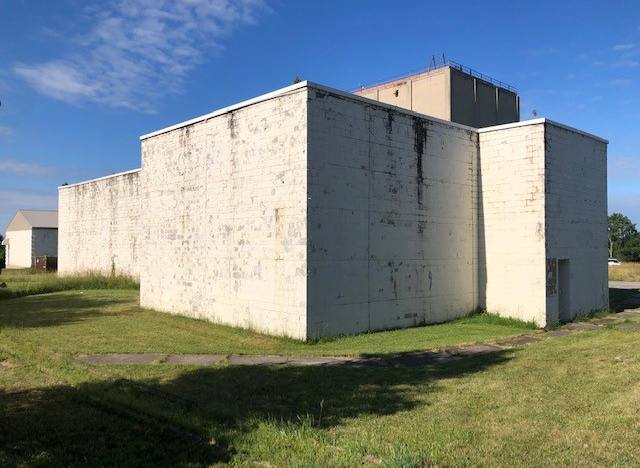
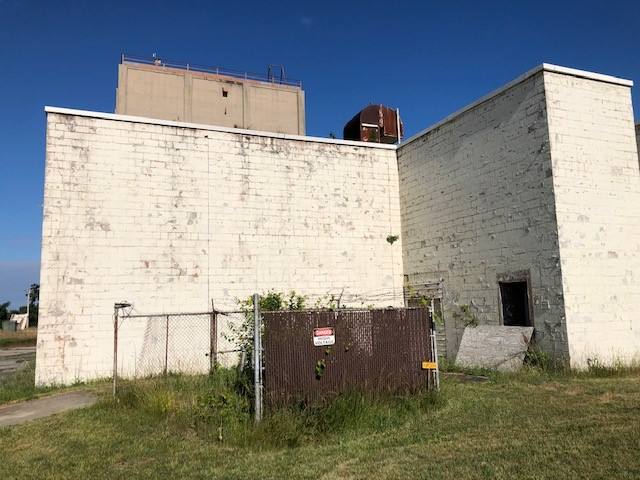
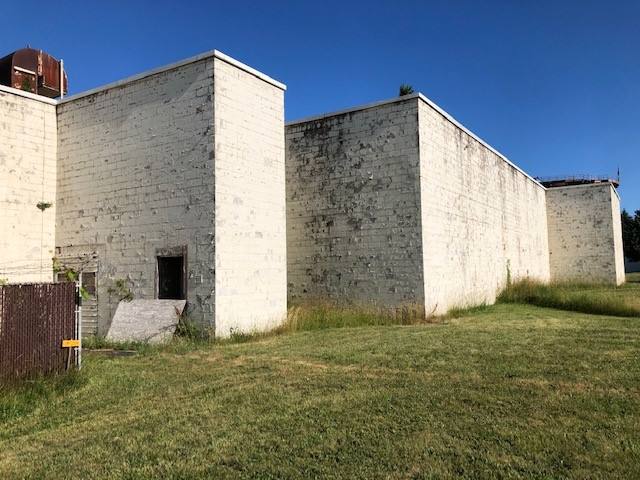
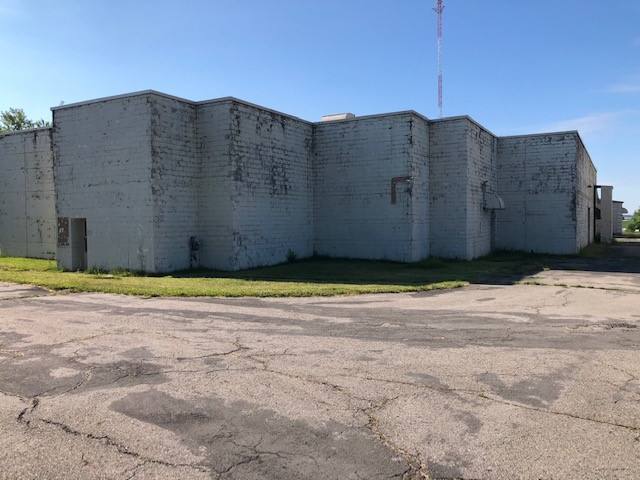
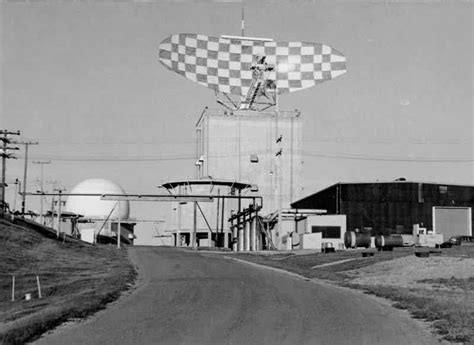
• Formerly housed the electronics for the US Air Force Station from 1950-1990
• building within in a building and made to withstand a nuclear blast
Additional Photos
Listing Agents

Charles Howard
O: 248-440-1447
charles.howard@transwestern.com
O: 248-440-1447
charles.howard@transwestern.com
While we strive to provide the most accurate information, all listing information, and demographic data, is provided by third-parties. As such, MyEListing will not be responsible for the accuracy of the information. It is strongly recommended that you verify all information with the listing agent, and any relevant agencies, prior to making any decisions.