Retail Space
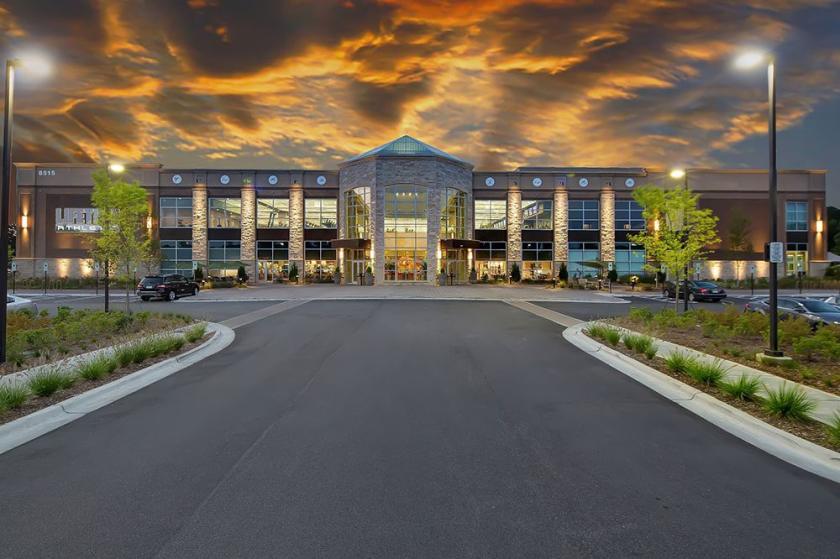
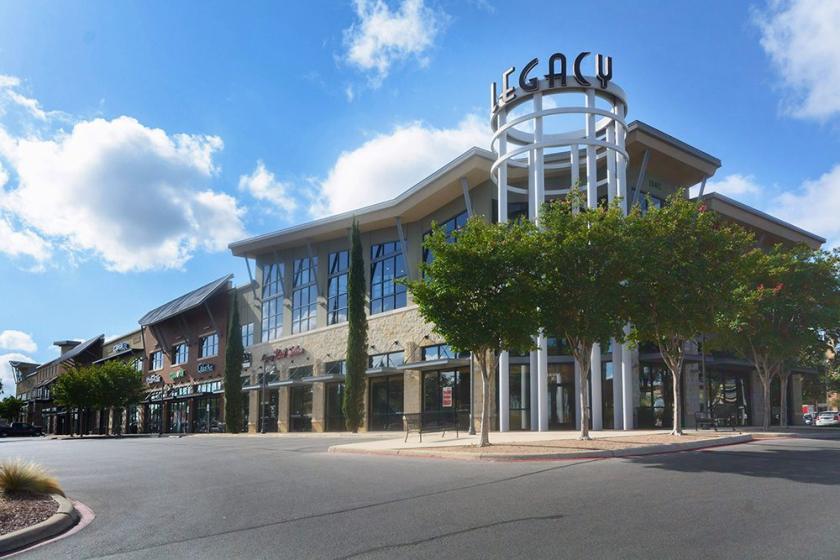
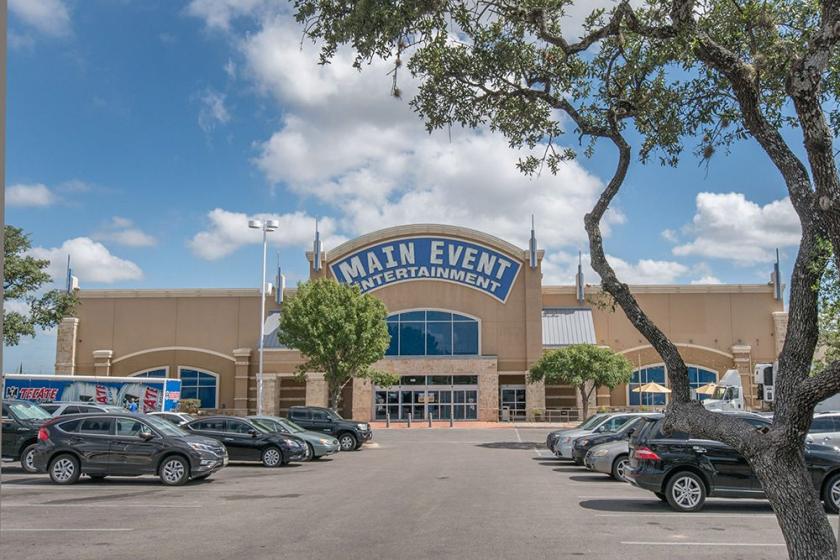
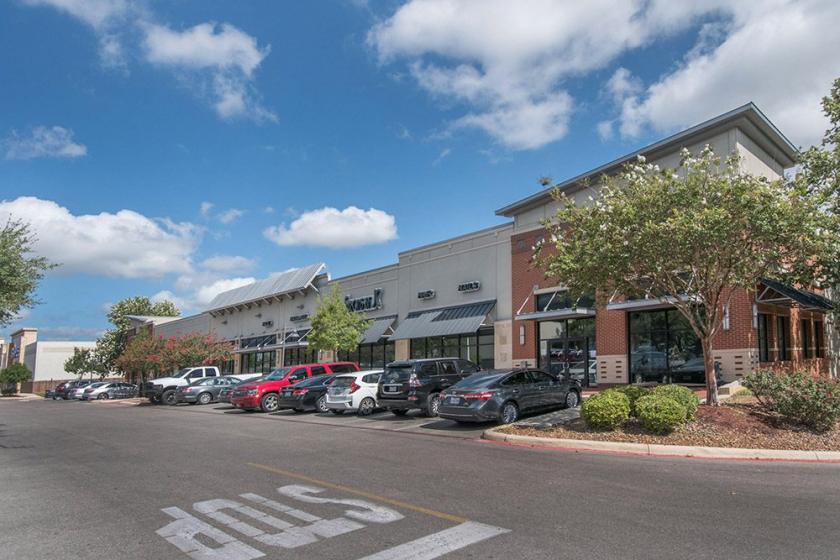
18402 U.S. Highway 281 North San Antonio, TX 78259
18402 U.S. Highway 281 North San Antonio, TX 78259
Details & Description
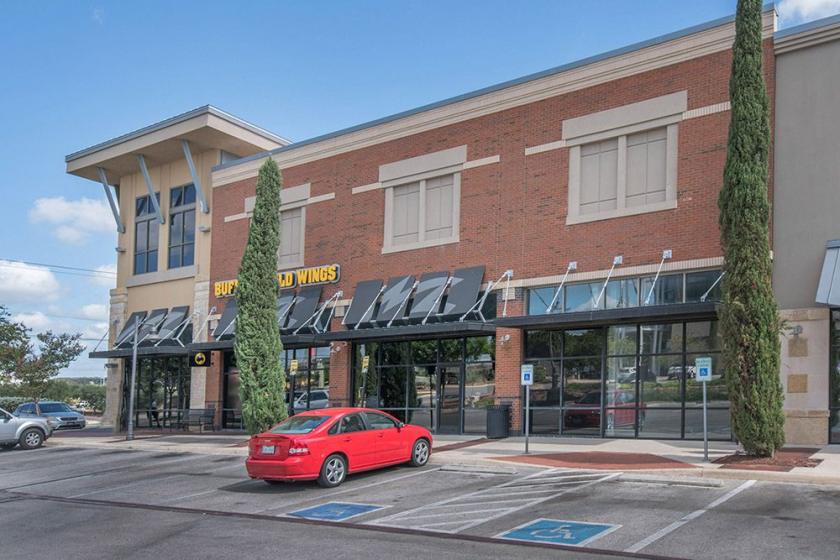
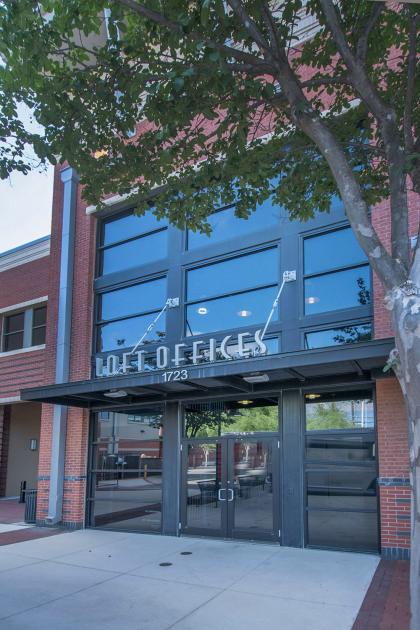
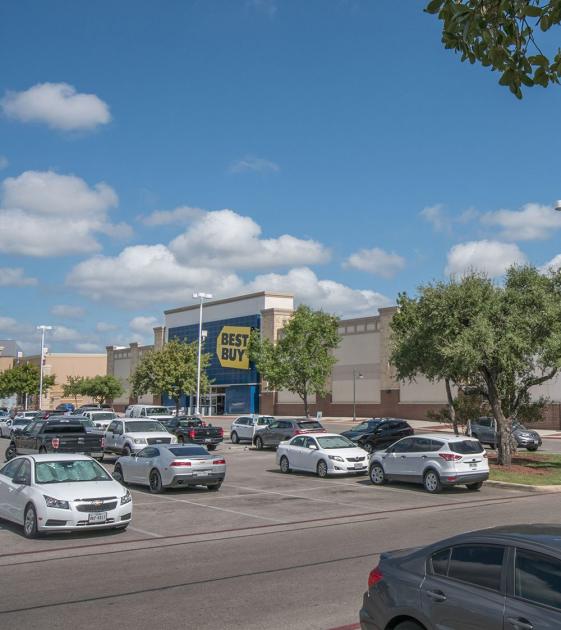
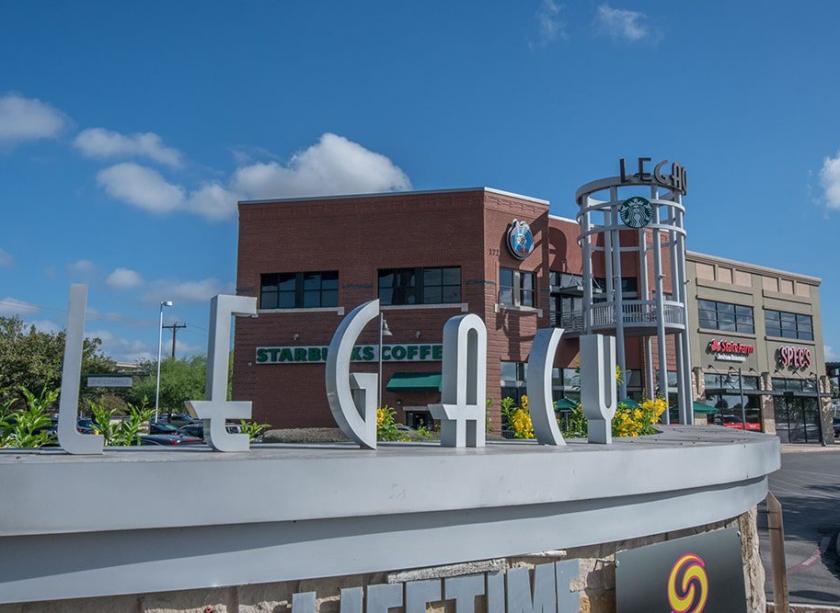
Additional Photos
Listing Agents

Jared Davis
O: 210-824-4242
M: 830-431-2636
jared@valcorcre.com
O: 210-824-4242
M: 830-431-2636
jared@valcorcre.com

Sara Lombardi
Valcor CRE
O: 210-824-4242
M: 210-858-7907
sara@valcorcre.com
Valcor CRE
O: 210-824-4242
M: 210-858-7907
sara@valcorcre.com

Jonathan Collins
O: 210-824-4242
M: 210-269-1886
jonathan@valcorcre.com
O: 210-824-4242
M: 210-269-1886
jonathan@valcorcre.com
While we strive to provide the most accurate information, all listing information, and demographic data, is provided by third-parties. As such, MyEListing will not be responsible for the accuracy of the information. It is strongly recommended that you verify all information with the listing agent, and any relevant agencies, prior to making any decisions.