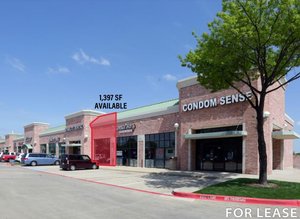
1-Mile | 3-Miles | 5-Miles | ||
---|---|---|---|---|
Total Population | 35,066 | 166,022 | 416,827 | |
Population Median Age | 32 | 34 | 36 | |
Population by Age | 0-9 Yrs | 6170 (17%) | 27617 (16%) | 61664 (14%) |
10-19 Yrs | 3317 (9%) | 19183 (11%) | 50195 (12%) | |
20-29 Yrs | 6568 (18%) | 26460 (15%) | 66877 (16%) | |
30-39 Yrs | 6780 (19%) | 28448 (17%) | 67514 (16%) | |
40-49 Yrs | 5463 (15%) | 22699 (13%) | 52222 (12%) | |
50-59 Yrs | 3229 (9%) | 17547 (10%) | 47849 (11%) | |
60-69 Yrs | 2054 (5%) | 12877 (7%) | 36889 (8%) | |
70+ Yrs | 1484 (4%) | 11192 (6%) | 33617 (8%) | |
Median HH Income | $42,703 | $51,646 | $59,795 | |
Total Household Income | < 24K | 3998 (26%) | 13610 (21%) | 28044 (17%) |
25-49K | 5061 (33%) | 17655 (27%) | 40344 (24%) | |
50-74K | 3181 (20%) | 11602 (18%) | 28524 (17%) | |
75-99K | 1130 (7%) | 6411 (9%) | 18336 (11%) | |
100-199K | 1362 (8%) | 9976 (15%) | 30877 (18%) | |
200K+ | 578 (3%) | 5016 (7%) | 16567 (10%) | |
Highest Education Level | No Diploma | 3034 | 17662 | 43627 |
Diploma or GED | 5992 | 21208 | 50730 | |
Some College | 5877 | 22822 | 53931 | |
Assoc. Degree | 1176 | 7494 | 17056 | |
Bachelors Degree | 3961 | 24782 | 68823 | |
Higher Degree | 2835 | 14267 | 42067 | |
Total Housing Units | 17,072 | 71,070 | 179,486 | |
--Owner-Occupied | 2,961 | 22,900 | 70,360 | |
--Renter-Occupied | 12,347 | 41,370 | 92,330 | |
Owner-Occupied Values | < 100K | 351 | 1607 | 5434 |
100-199K | 602 | 5552 | 19791 | |
200-299K | 504 | 5010 | 15088 | |
300-399K | 541 | 4202 | 9084 | |
400-499K | 338 | 2649 | 5533 | |
500K+ | 626 | 3879 | 15431 | |
Total Working Age Population | 26,915 | 125,991 | 323,186 | |
In Work Force | 20,223 | 90,066 | 230,446 | |
Not In Work Force | 6,693 | 35,925 | 92,740 | |
Workforce Employed | 19,056 | 85,716 | 220,178 | |
Workforce Unemployed | 1,145 | 4,277 | 10,103 | |
Civlian Workforce | 20,200 | 89,993 | 230,281 | |
Military Workforce | 22 | 73 | 164 | |
Total Households | 15,309 | 64,270 | 162,691 | |
Family Households | 8,124 | 38,521 | 97,140 | |
Non-Family Households | 7,184 | 25,750 | 65,551 | |
Married Couple | 4,778 | 26,317 | 68,962 | |
Other Family | 3,346 | 12,203 | 28,178 | |
Married w/Child | 2,300 | 13,366 | 31,571 | |
Single Male w/Child | 510 | 1,749 | 3,705 | |
Single Female w/Child | 1,440 | 4,661 | 10,892 |
Population Change Last Two Decades - Plus Projection
2000 | % | 2010 | % | 2020 | % | 2030 | |
---|---|---|---|---|---|---|---|
Texas | 20,851,820 | +21 | 25,145,561 | +18 | 29,677,668 | +18 | 34,894,452 |
Dallas County | 2,218,899 | +7 | 2,368,139 | +15 | 2,734,111 | +14 | 3,106,298 |
Total Working Age Population:
Total Households:
Total Working Age Population:
Total Households:
Total Working Age Population:
Total Households: