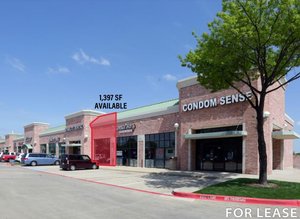
1-Mile | 3-Miles | 5-Miles | ||
---|---|---|---|---|
Total Population | 15,029 | 156,819 | 366,319 | |
Population Median Age | 39 | 36 | 36 | |
Population by Age | 0-9 Yrs | 1862 (12%) | 23510 (14%) | 52879 (14%) |
10-19 Yrs | 2014 (13%) | 20281 (12%) | 46669 (12%) | |
20-29 Yrs | 1733 (11%) | 24719 (15%) | 58128 (15%) | |
30-39 Yrs | 2173 (14%) | 23694 (15%) | 55576 (15%) | |
40-49 Yrs | 1335 (8%) | 19040 (12%) | 45243 (12%) | |
50-59 Yrs | 2496 (16%) | 18188 (11%) | 43819 (11%) | |
60-69 Yrs | 1941 (12%) | 14979 (9%) | 33505 (9%) | |
70+ Yrs | 1476 (9%) | 12408 (7%) | 30500 (8%) | |
Median HH Income | $91,158 | $61,898 | $62,829 | |
Total Household Income | < 24K | 464 (9%) | 8863 (16%) | 21704 (16%) |
25-49K | 862 (17%) | 12787 (23%) | 31321 (23%) | |
50-74K | 618 (12%) | 10289 (18%) | 24789 (18%) | |
75-99K | 903 (17%) | 6874 (12%) | 16769 (12%) | |
100-199K | 1711 (33%) | 12649 (23%) | 28999 (21%) | |
200K+ | 499 (9%) | 3100 (5%) | 10538 (7%) | |
Highest Education Level | No Diploma | 1498 | 17455 | 36892 |
Diploma or GED | 1212 | 19368 | 44576 | |
Some College | 2395 | 22346 | 49171 | |
Assoc. Degree | 1230 | 8425 | 16663 | |
Bachelors Degree | 2807 | 23330 | 57740 | |
Higher Degree | 1472 | 11348 | 33499 | |
Total Housing Units | 5,184 | 57,932 | 145,209 | |
--Owner-Occupied | 3,434 | 28,122 | 64,063 | |
--Renter-Occupied | 1,623 | 26,439 | 70,057 | |
Owner-Occupied Values | < 100K | 122 | 1444 | 4288 |
100-199K | 816 | 10676 | 19628 | |
200-299K | 1767 | 9690 | 17158 | |
300-399K | 666 | 3937 | 11342 | |
400-499K | 26 | 1202 | 5853 | |
500K+ | 37 | 1173 | 5794 | |
Total Working Age Population | 11,746 | 120,691 | 285,367 | |
In Work Force | 8,375 | 83,525 | 198,729 | |
Not In Work Force | 3,371 | 37,166 | 86,638 | |
Workforce Employed | 8,124 | 79,627 | 188,843 | |
Workforce Unemployed | 245 | 3,835 | 9,753 | |
Civlian Workforce | 8,369 | 83,462 | 198,596 | |
Military Workforce | 6 | 63 | 133 | |
Total Households | 5,057 | 54,561 | 134,121 | |
Family Households | 3,942 | 37,169 | 86,449 | |
Non-Family Households | 1,116 | 17,391 | 47,671 | |
Married Couple | 3,114 | 25,422 | 61,435 | |
Other Family | 828 | 11,748 | 25,014 | |
Married w/Child | 1,029 | 11,579 | 27,129 | |
Single Male w/Child | 83 | 1,727 | 3,468 | |
Single Female w/Child | 340 | 4,101 | 9,374 |
Population Change Last Two Decades - Plus Projection
2000 | % | 2010 | % | 2020 | % | 2030 | |
---|---|---|---|---|---|---|---|
Texas | 20,851,820 | +21 | 25,145,561 | +18 | 29,677,668 | +18 | 34,894,452 |
Collin County | 491,675 | +59 | 782,341 | +33 | 1,039,369 | +34 | 1,391,461 |
Dallas County | 2,218,899 | +7 | 2,368,139 | +15 | 2,734,111 | +14 | 3,106,298 |
Total Working Age Population:
Total Households:
Total Working Age Population:
Total Households:
Total Working Age Population:
Total Households: