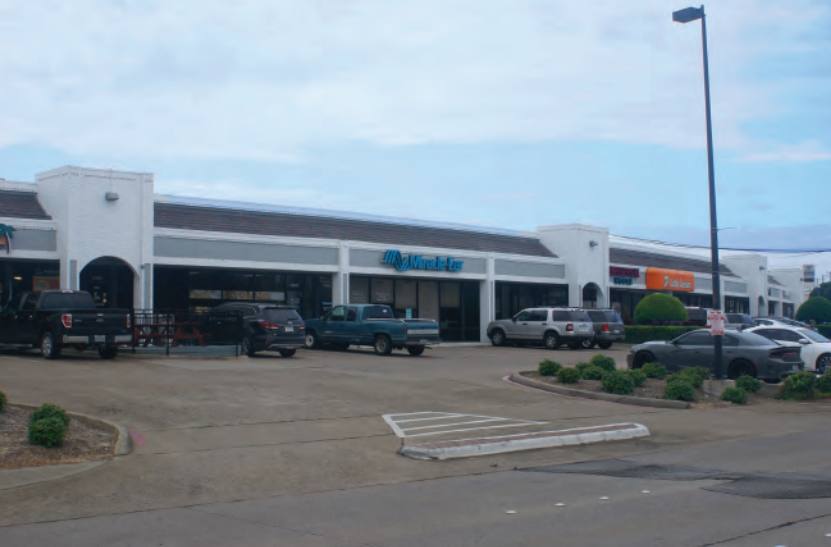
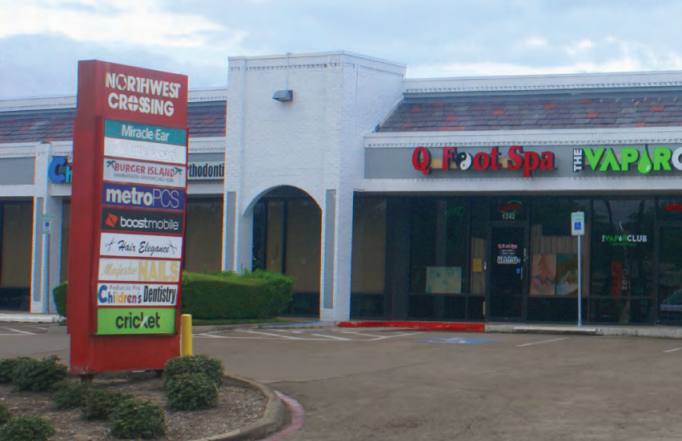
Retail Space
1202-1250 Northwest Hwy Garland, TX 75041
1202-1250 Northwest Hwy Garland, TX 75041
Details & Description
Property Highlights
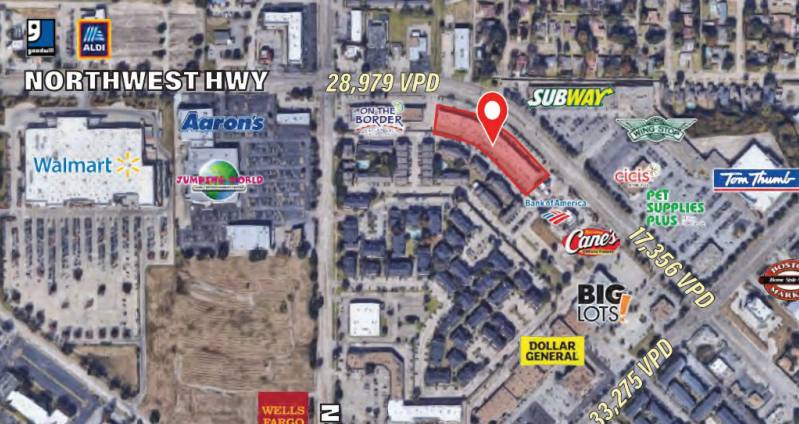
• Traffic generators - Tom Thumb, Walmart, LA Fitness, Wing Stop, AMF
• Strong traffic counts
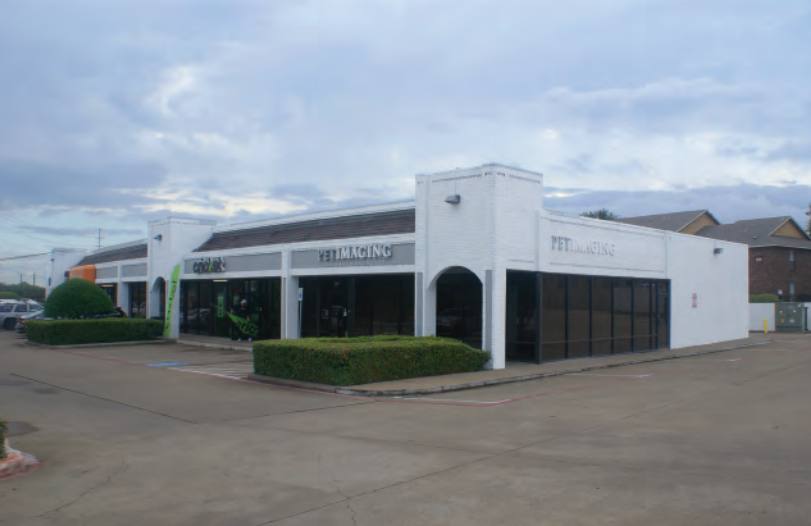
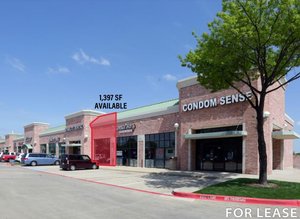
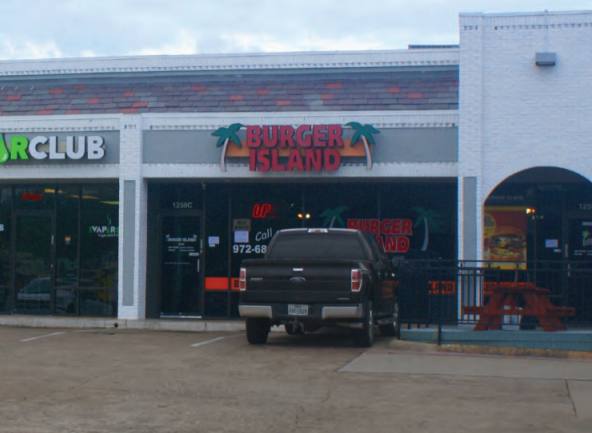
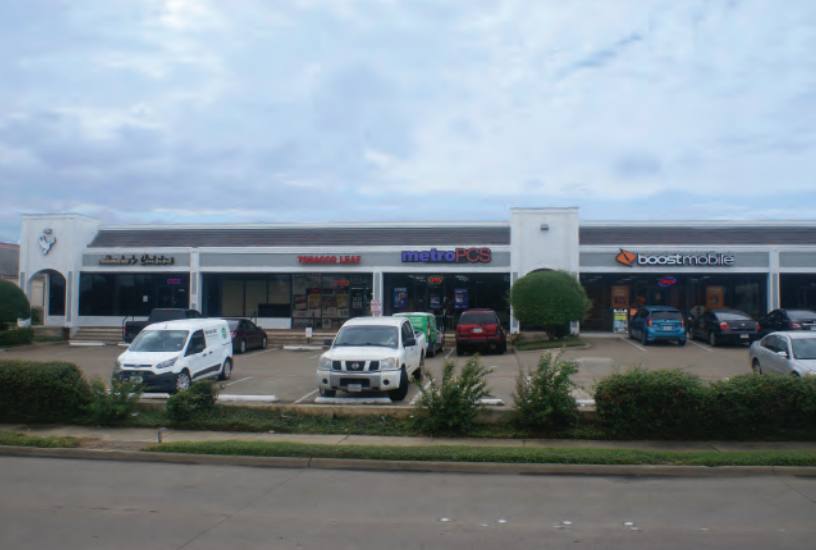
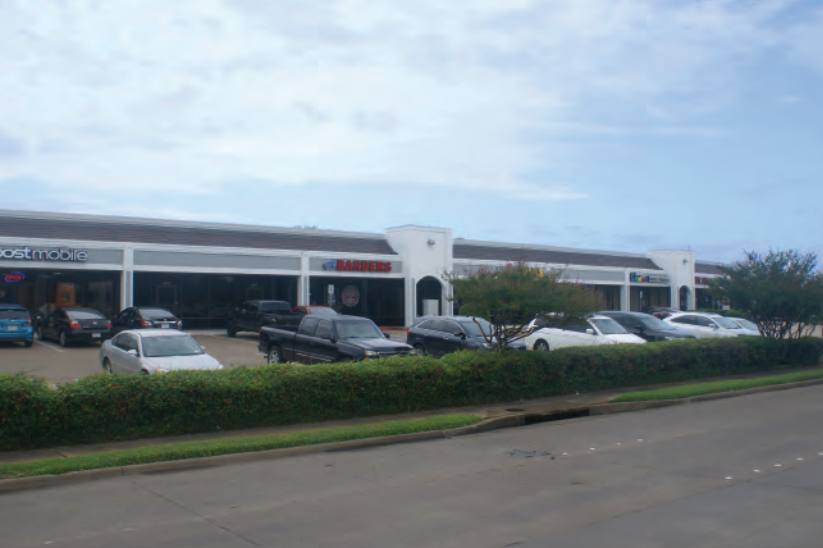
Additional Photos
Listing Agents

John Hiller
O: 214-466-1546
M: 214-668-7365
john@structurecommercial.com
O: 214-466-1546
M: 214-668-7365
john@structurecommercial.com

Eric Deuillet
O: 214-373-8300
M: 214-466-1545
eric@structurecommercial.com
O: 214-373-8300
M: 214-466-1545
eric@structurecommercial.com
While we strive to provide the most accurate information, all listing information, and demographic data, is provided by third-parties. As such, MyEListing will not be responsible for the accuracy of the information. It is strongly recommended that you verify all information with the listing agent, and any relevant agencies, prior to making any decisions.