Retail Space
2310 North Henderson Avenue Dallas, TX 75206
2310 North Henderson Avenue Dallas, TX 75206
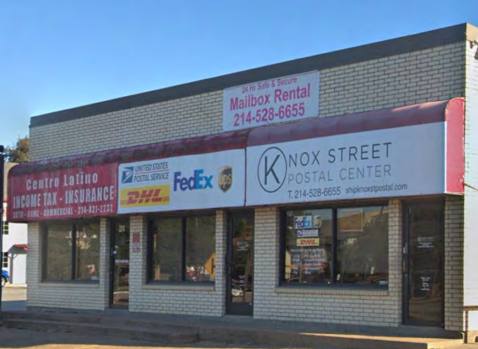
Details & Description
Property Highlights
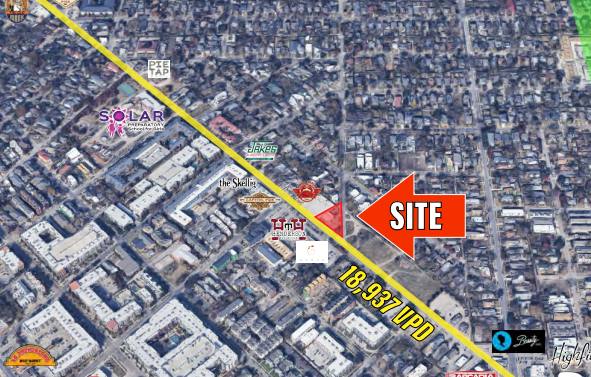
• Traffic generators - Sprouts, Jake's, Henderson Tap House, Veritas Wine Room
• Traffic generators - Sprouts, Jake's, Henderson Tap House, Veritas Wine Room
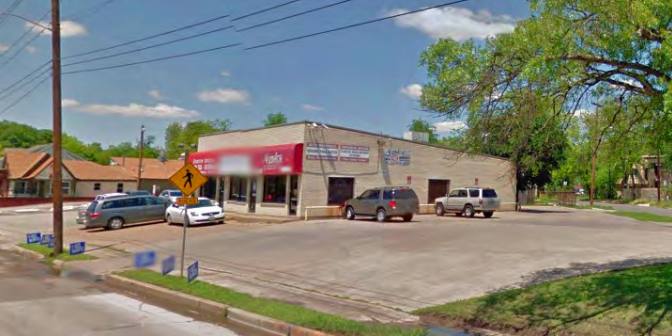
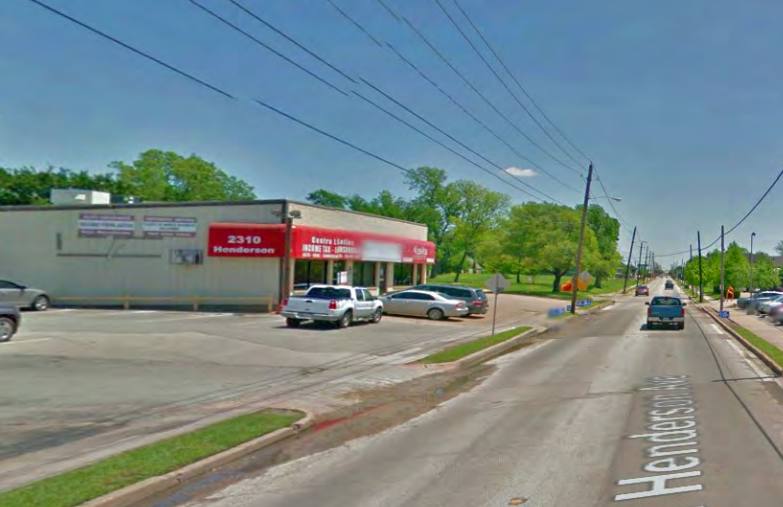
Additional Photos
Listing Agents

Jake Burns
O: 214-466-1549
M: 405-830-5304
jake@structurecommercial.com
O: 214-466-1549
M: 405-830-5304
jake@structurecommercial.com

Eric Deuillet
O: 214-373-8300
M: 214-466-1545
eric@structurecommercial.com
O: 214-373-8300
M: 214-466-1545
eric@structurecommercial.com
While we strive to provide the most accurate information, all listing information, and demographic data, is provided by third-parties. As such, MyEListing will not be responsible for the accuracy of the information. It is strongly recommended that you verify all information with the listing agent, and any relevant agencies, prior to making any decisions.


