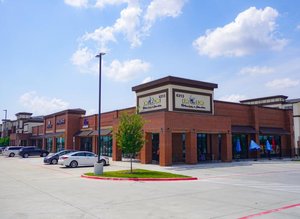
Retail Space
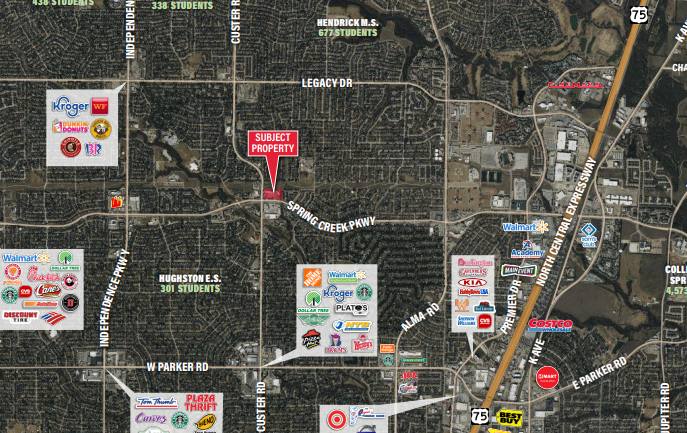
2011 West Spring Creek Parkway Plano, TX 75023
2011 West Spring Creek Parkway Plano, TX 75023
Details & Description
Property Highlights
- • High populated residential area
- • Great visbility
- • Long term tenants
- • Close proximity to 75 and Bush Turnpike
- • 3.67 acres
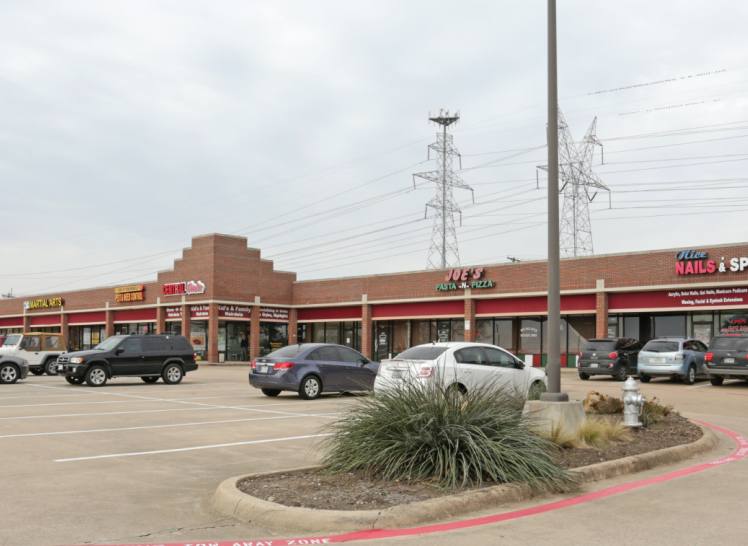
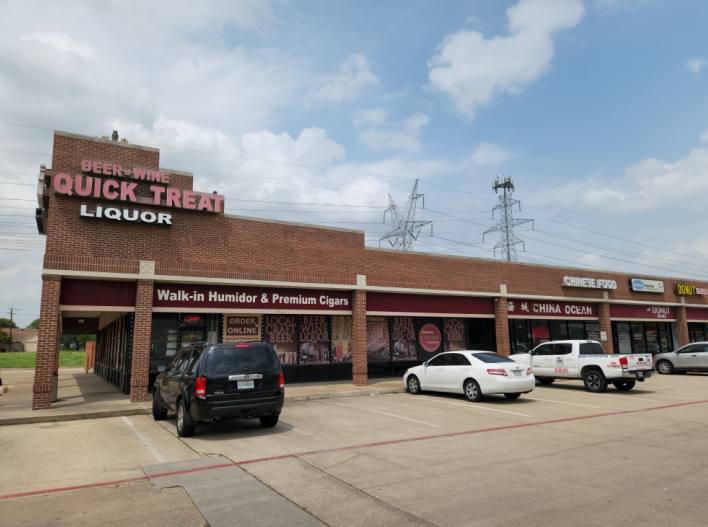
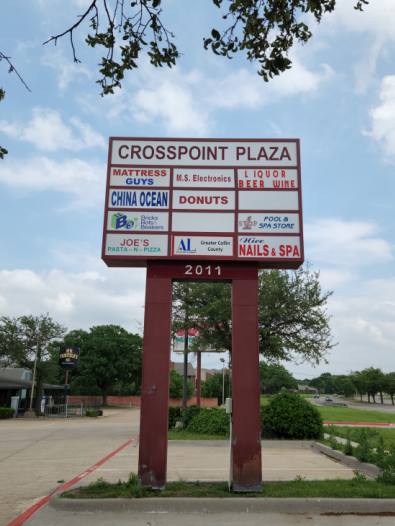
Additional Photos
Listing Agents

Jeremy Cummings
O: 214-466-1544
M: 214-636-2549
jeremy@structurecommercial.com
O: 214-466-1544
M: 214-636-2549
jeremy@structurecommercial.com

Eric Deuillet
O: 214-373-8300
M: 214-466-1545
eric@structurecommercial.com
O: 214-373-8300
M: 214-466-1545
eric@structurecommercial.com
While we strive to provide the most accurate information, all listing information, and demographic data, is provided by third-parties. As such, MyEListing will not be responsible for the accuracy of the information. It is strongly recommended that you verify all information with the listing agent, and any relevant agencies, prior to making any decisions.