Retail Space
6750-6780 Abrams Rd Dallas, TX 75231
6750-6780 Abrams Rd Dallas, TX 75231
Details & Description
Property Highlights
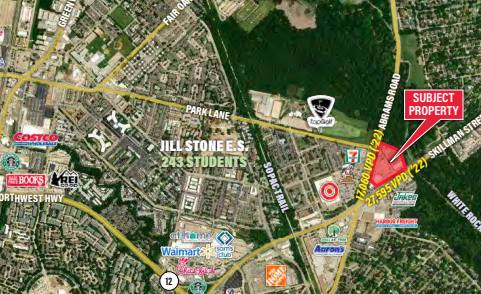
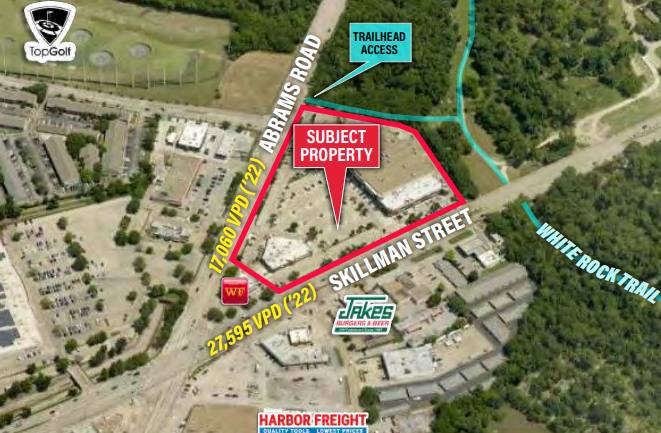
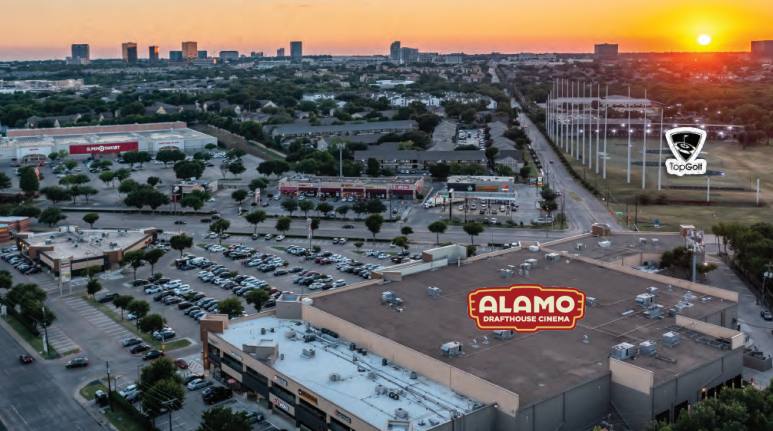
• Creekside brings quality entertainment and dining options to the residents of East Dallas
• Creekside is the gateway to Lake Highlands
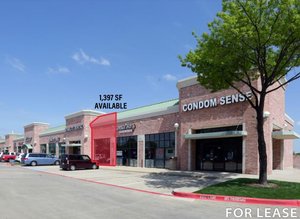
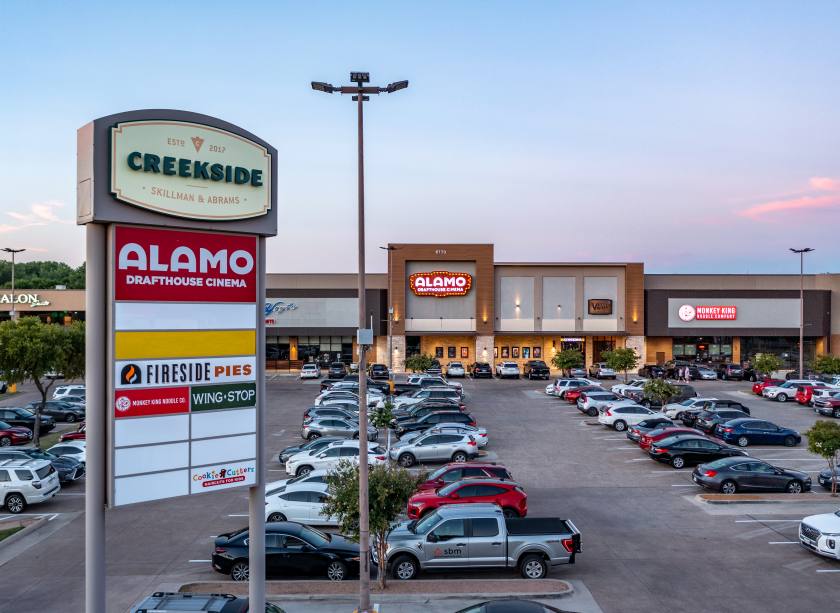
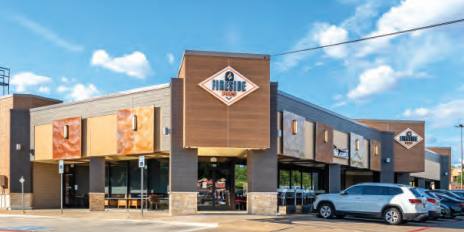
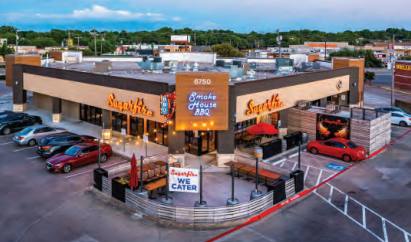
Additional Photos
Listing Agents

John Hiller
O: 214-466-1546
M: 214-668-7365
john@structurecommercial.com
O: 214-466-1546
M: 214-668-7365
john@structurecommercial.com

Kyle Montana
O: 214-373-8300
M: 214-466-1556
kyle@structurecommercial.com
O: 214-373-8300
M: 214-466-1556
kyle@structurecommercial.com

Eric Deuillet
O: 214-373-8300
M: 214-466-1545
eric@structurecommercial.com
O: 214-373-8300
M: 214-466-1545
eric@structurecommercial.com
While we strive to provide the most accurate information, all listing information, and demographic data, is provided by third-parties. As such, MyEListing will not be responsible for the accuracy of the information. It is strongly recommended that you verify all information with the listing agent, and any relevant agencies, prior to making any decisions.