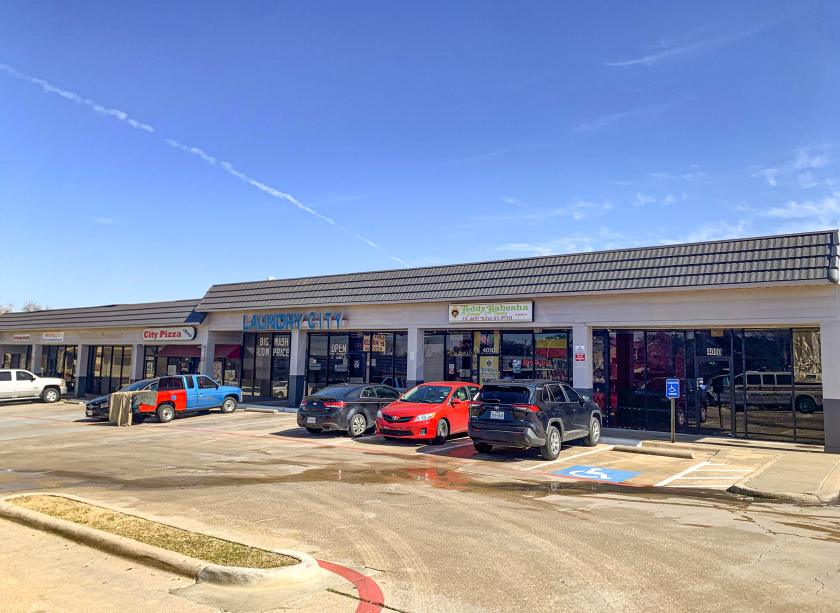
Retail Space
4008 North Belt Line Road Irving, TX 75038
4008 North Belt Line Road Irving, TX 75038
Details & Description
Property Highlights
- • Monument signage available
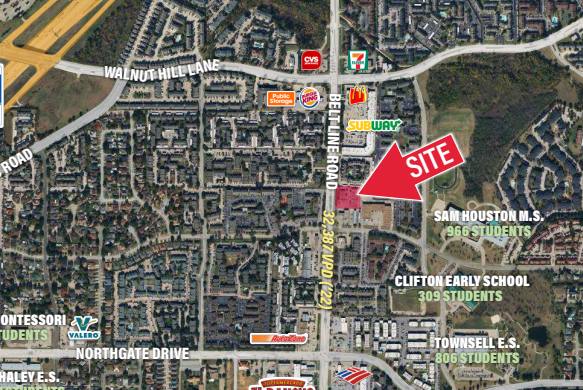
- • Proximity to DFW International Airport
- • Quick access to Bush Turnpike, 183 and 114
- • Year Built - 1983
- • 1.45 acres
Listing Agents

Kyle Montana
O: 214-373-8300
M: 214-466-1556
kyle@structurecommercial.com
O: 214-373-8300
M: 214-466-1556
kyle@structurecommercial.com

Eric Deuillet
O: 214-373-8300
M: 214-466-1545
eric@structurecommercial.com
O: 214-373-8300
M: 214-466-1545
eric@structurecommercial.com
While we strive to provide the most accurate information, all listing information, and demographic data, is provided by third-parties. As such, MyEListing will not be responsible for the accuracy of the information. It is strongly recommended that you verify all information with the listing agent, and any relevant agencies, prior to making any decisions.