Retail Space
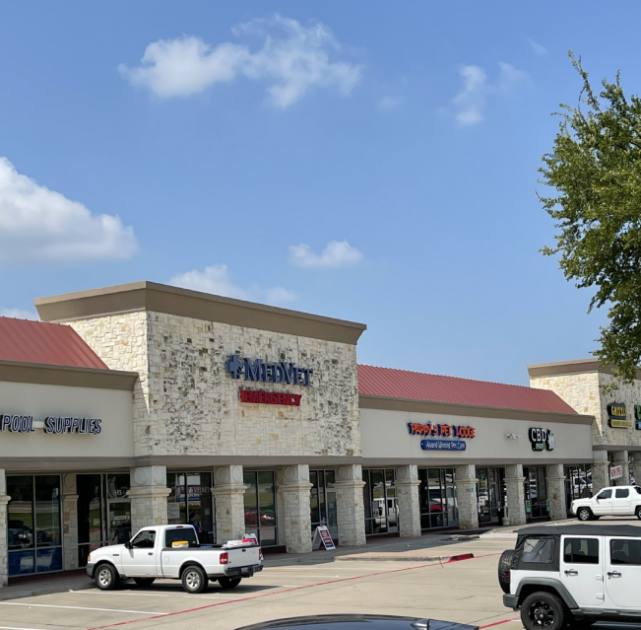
401 West President George Bush Highway Richardson, TX 75080
401 West President George Bush Highway Richardson, TX 75080
Details & Description
Property Highlights
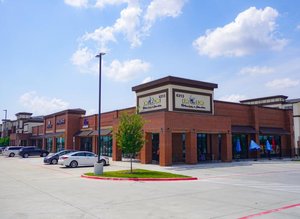
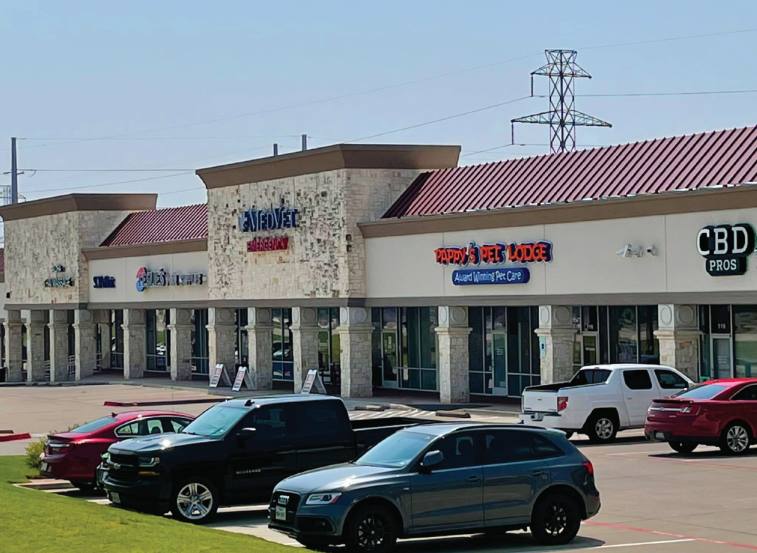
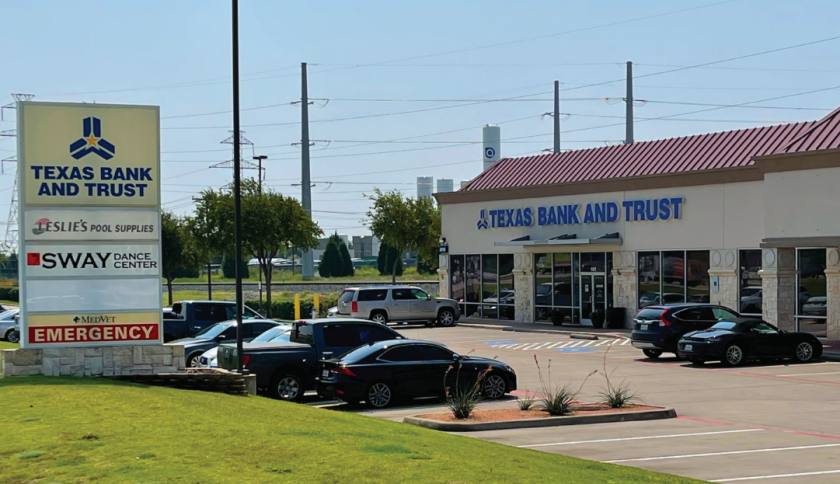
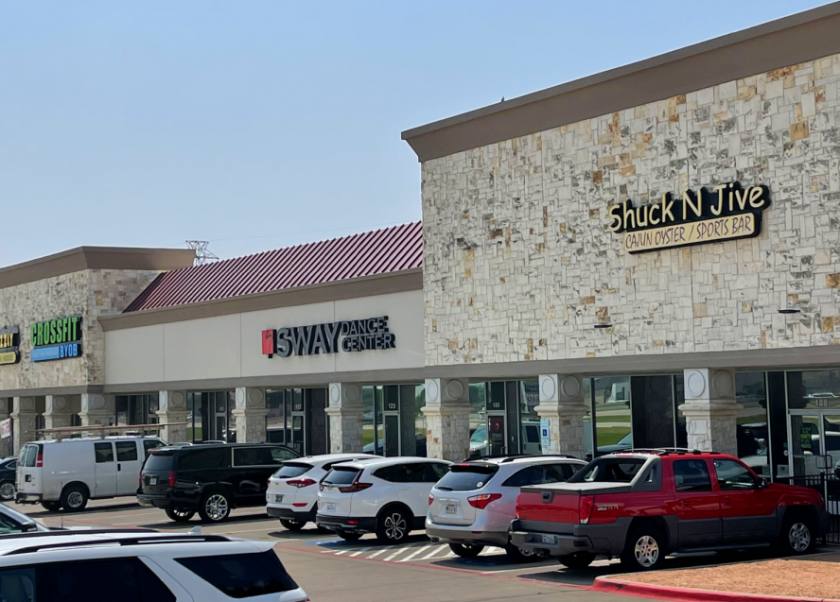
- • Beautiful, highly visible center
- • Pylon signage available
- • Tenant improvements available
Additional Photos
Listing Agents

Jeremy Cummings
O: 214-466-1544
M: 214-636-2549
jeremy@structurecommercial.com
O: 214-466-1544
M: 214-636-2549
jeremy@structurecommercial.com

Eric Deuillet
O: 214-373-8300
M: 214-466-1545
eric@structurecommercial.com
O: 214-373-8300
M: 214-466-1545
eric@structurecommercial.com
While we strive to provide the most accurate information, all listing information, and demographic data, is provided by third-parties. As such, MyEListing will not be responsible for the accuracy of the information. It is strongly recommended that you verify all information with the listing agent, and any relevant agencies, prior to making any decisions.