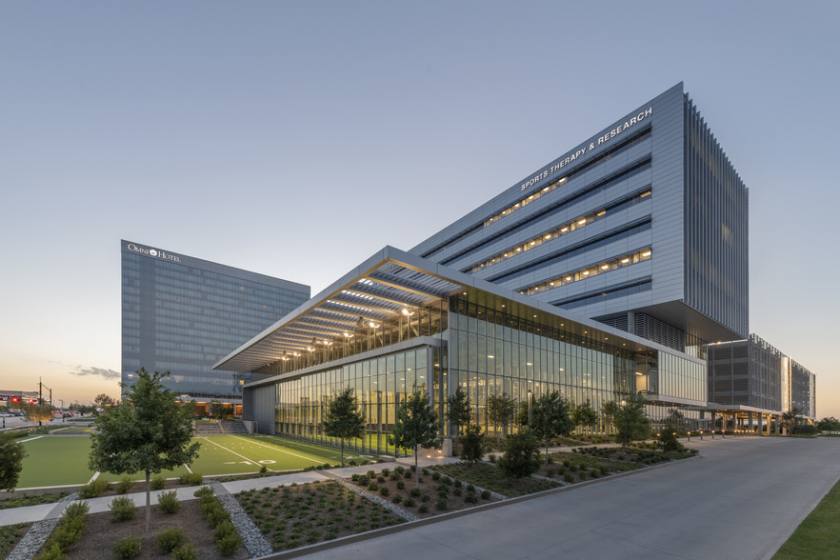
Office Space
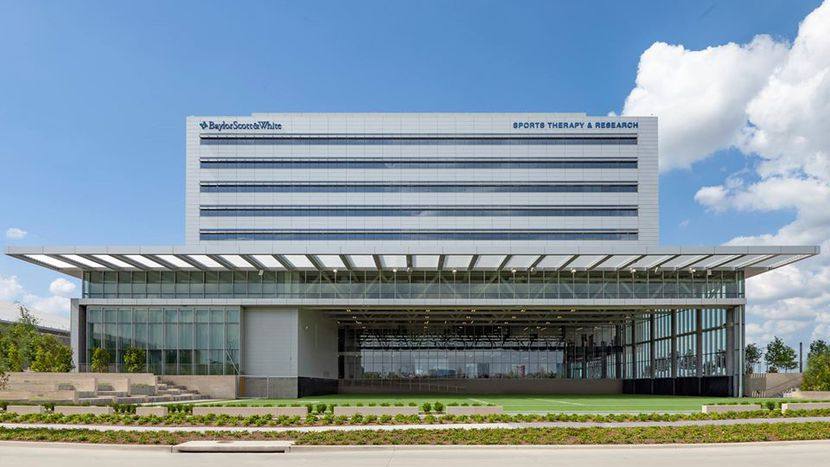
3800 Gaylord Parkway Frisco, TX 75034
3800 Gaylord Parkway Frisco, TX 75034
Details & Description
Property Highlights
- • Dallas Cowboys Headquarters
- • Ambulatory Surgery Center
- • Urgent Care Facility
- • Physical Therapy and Rehab
- • Gatorade Sports Science Institute
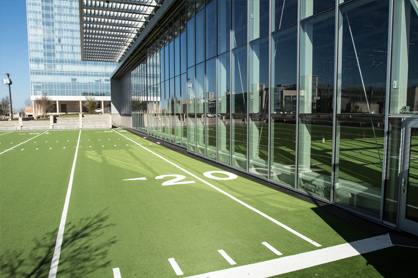
- • Sports Performance Center
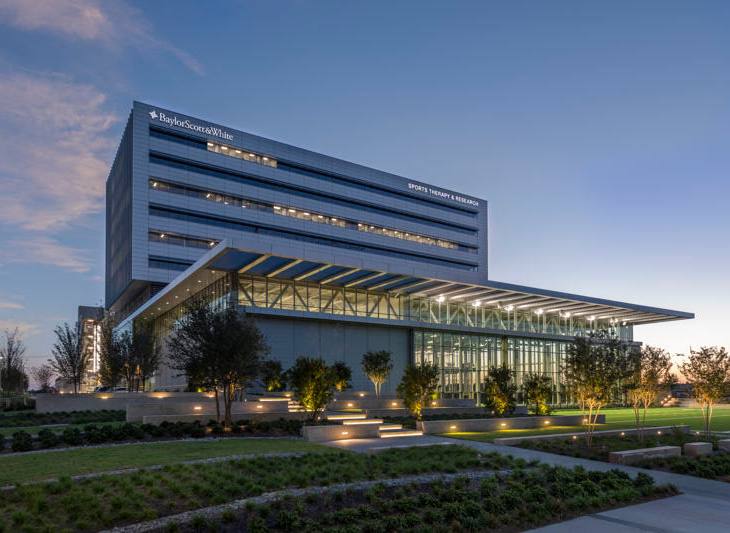
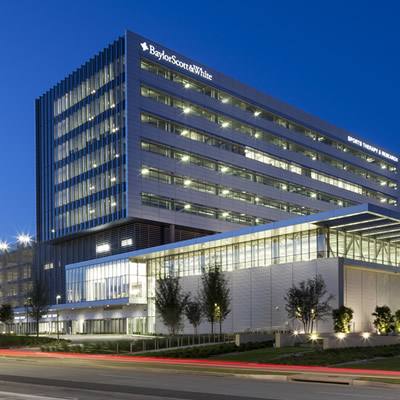
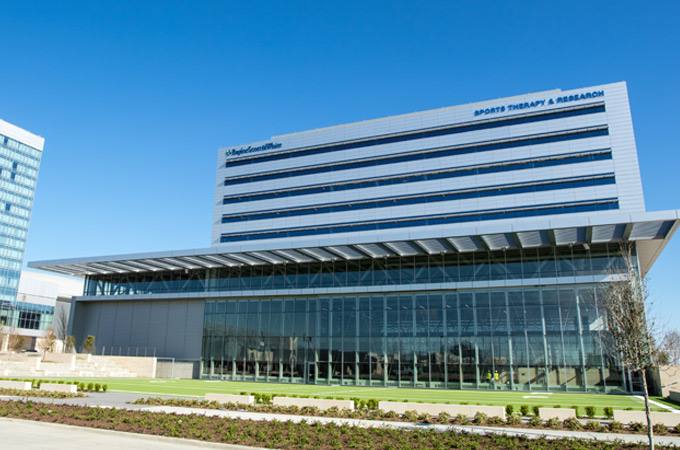
Additional Photos
Listing Agents

Rachel Serio
O: 214-461-2366
rserio@lpc.com
O: 214-461-2366
rserio@lpc.com
While we strive to provide the most accurate information, all listing information, and demographic data, is provided by third-parties. As such, MyEListing will not be responsible for the accuracy of the information. It is strongly recommended that you verify all information with the listing agent, and any relevant agencies, prior to making any decisions.