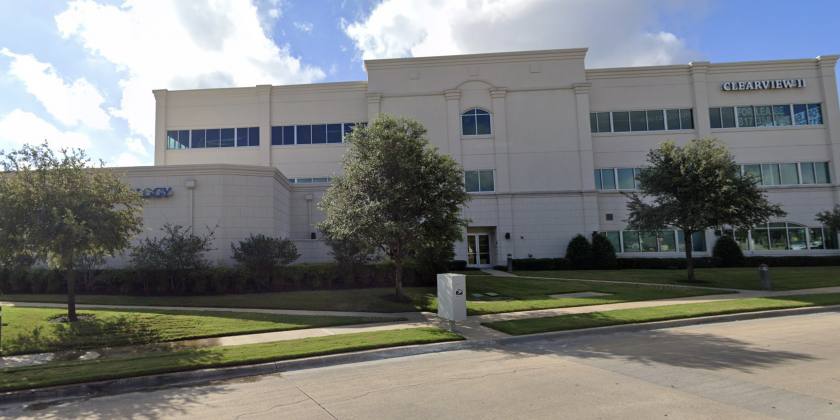
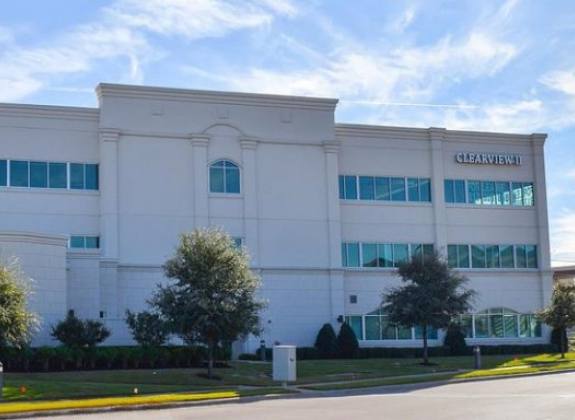
1-Mile | 3-Miles | 5-Miles | ||
---|---|---|---|---|
Total Population | 4,705 | 48,894 | 121,363 | |
Population Median Age | 41 | 39 | 38 | |
Population by Age | 0-9 Yrs | 485 (10%) | 5963 (12%) | 14820 (12%) |
10-19 Yrs | 515 (10%) | 6353 (12%) | 17829 (14%) | |
20-29 Yrs | 570 (12%) | 6117 (12%) | 13518 (11%) | |
30-39 Yrs | 618 (13%) | 5884 (12%) | 13893 (11%) | |
40-49 Yrs | 686 (14%) | 6526 (13%) | 18483 (15%) | |
50-59 Yrs | 776 (16%) | 8396 (17%) | 20449 (16%) | |
60-69 Yrs | 638 (13%) | 5889 (12%) | 13420 (11%) | |
70+ Yrs | 418 (8%) | 3766 (7%) | 8951 (7%) | |
Median HH Income | $78,969 | $95,602 | $117,643 | |
Total Household Income | < 24K | 226 (11%) | 1610 (8%) | 2865 (6%) |
25-49K | 389 (19%) | 2694 (14%) | 5052 (11%) | |
50-74K | 315 (16%) | 3244 (17%) | 6057 (13%) | |
75-99K | 311 (15%) | 2294 (12%) | 5080 (11%) | |
100-199K | 389 (19%) | 5351 (28%) | 14111 (31%) | |
200K+ | 328 (16%) | 3684 (19%) | 11072 (25%) | |
Highest Education Level | No Diploma | 440 | 2685 | 4087 |
Diploma or GED | 639 | 5222 | 11039 | |
Some College | 969 | 6712 | 15698 | |
Assoc. Degree | 174 | 1928 | 5136 | |
Bachelors Degree | 935 | 11819 | 29748 | |
Higher Degree | 328 | 5245 | 16775 | |
Total Housing Units | 2,157 | 19,769 | 46,151 | |
--Owner-Occupied | 989 | 11,271 | 29,379 | |
--Renter-Occupied | 969 | 7,606 | 14,858 | |
Owner-Occupied Values | < 100K | 123 | 645 | 1210 |
100-199K | 142 | 768 | 1751 | |
200-299K | 250 | 2532 | 4416 | |
300-399K | 256 | 2628 | 5492 | |
400-499K | 103 | 1816 | 4871 | |
500K+ | 115 | 2882 | 11638 | |
Total Working Age Population | 3,961 | 38,983 | 94,792 | |
In Work Force | 2,869 | 28,806 | 68,294 | |
Not In Work Force | 1,091 | 10,177 | 26,498 | |
Workforce Employed | 2,763 | 27,434 | 65,470 | |
Workforce Unemployed | 106 | 1,372 | 2,823 | |
Civlian Workforce | 2,869 | 28,806 | 68,292 | |
Military Workforce | 0 | 0 | 2 | |
Total Households | 1,958 | 18,877 | 44,237 | |
Family Households | 1,072 | 12,528 | 31,895 | |
Non-Family Households | 886 | 6,349 | 12,342 | |
Married Couple | 825 | 10,341 | 27,221 | |
Other Family | 248 | 2,186 | 4,674 | |
Married w/Child | 320 | 4,424 | 12,183 | |
Single Male w/Child | 48 | 377 | 880 | |
Single Female w/Child | 87 | 689 | 1,509 |
Population Change Last Two Decades - Plus Projection
2000 | % | 2010 | % | 2020 | % | 2030 | |
---|---|---|---|---|---|---|---|
Texas | 20,851,820 | +21 | 25,145,561 | +18 | 29,677,668 | +18 | 34,894,452 |
Tarrant County | 1,446,219 | +25 | 1,809,034 | +19 | 2,143,755 | +17 | 2,507,170 |
Denton County | 432,976 | +53 | 662,614 | +36 | 897,953 | +37 | 1,234,110 |
Dallas County | 2,218,899 | +7 | 2,368,139 | +15 | 2,734,111 | +14 | 3,106,298 |
Total Working Age Population:
Total Households:
Total Working Age Population:
Total Households:
Total Working Age Population:
Total Households: