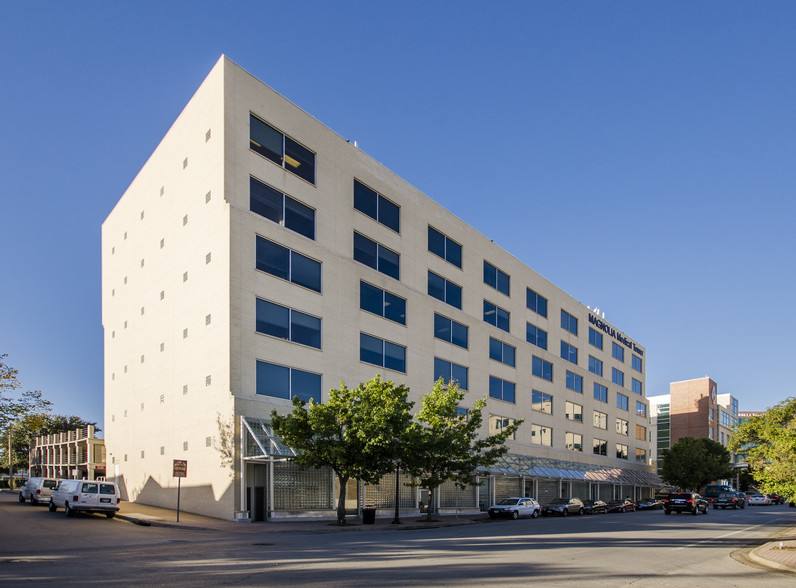
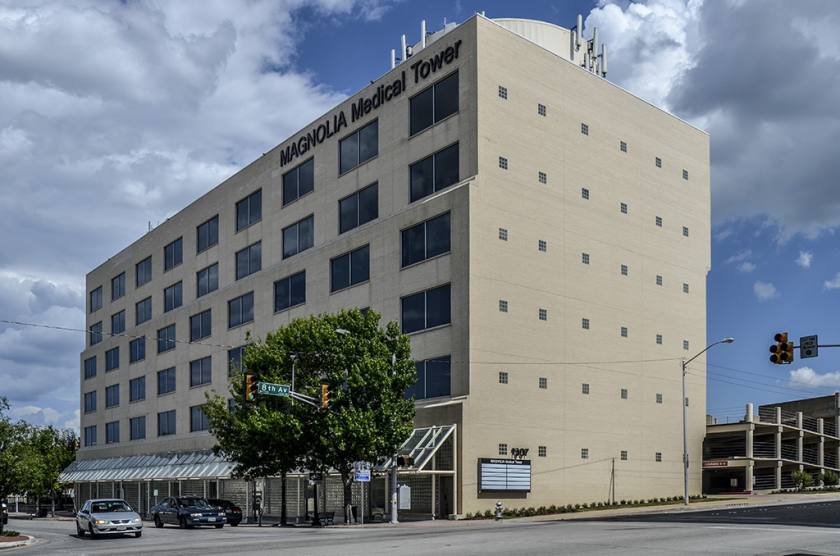
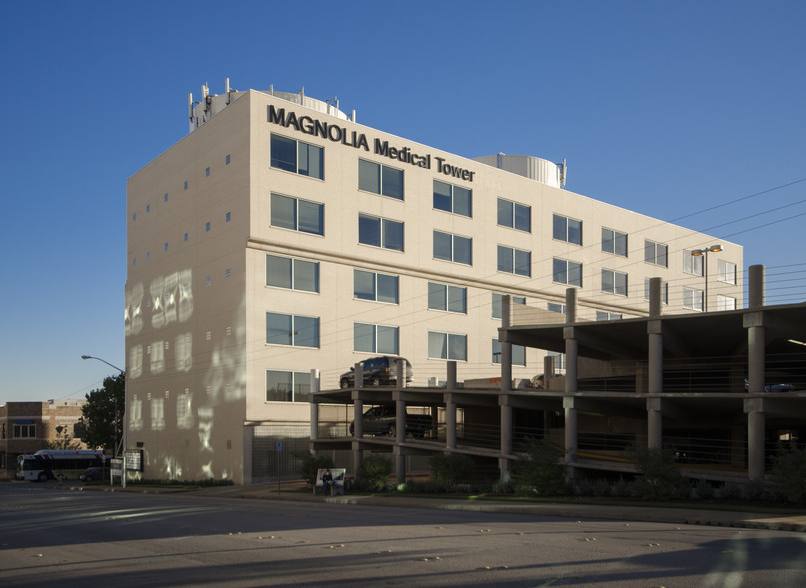
1-Mile | 3-Miles | 5-Miles | ||
---|---|---|---|---|
Total Population | 10,749 | 102,348 | 275,868 | |
Population Median Age | 39 | 35 | 35 | |
Population by Age | 0-9 Yrs | 1275 (11%) | 11698 (11%) | 37446 (13%) |
10-19 Yrs | 1031 (9%) | 14695 (14%) | 41707 (15%) | |
20-29 Yrs | 1634 (15%) | 21704 (21%) | 48935 (17%) | |
30-39 Yrs | 2150 (20%) | 15956 (15%) | 41197 (14%) | |
40-49 Yrs | 1103 (10%) | 11193 (10%) | 31854 (11%) | |
50-59 Yrs | 1255 (11%) | 9989 (9%) | 29929 (10%) | |
60-69 Yrs | 1165 (10%) | 9253 (9%) | 23753 (8%) | |
70+ Yrs | 1137 (10%) | 7860 (7%) | 21047 (7%) | |
Median HH Income | $77,747 | $58,896 | $54,203 | |
Total Household Income | < 24K | 748 (16%) | 8662 (22%) | 21808 (22%) |
25-49K | 694 (15%) | 7921 (20%) | 22597 (23%) | |
50-74K | 807 (17%) | 6465 (17%) | 18064 (19%) | |
75-99K | 465 (10%) | 4496 (11%) | 10821 (11%) | |
100-199K | 1246 (27%) | 6810 (17%) | 14920 (15%) | |
200K+ | 641 (13%) | 3502 (9%) | 6777 (7%) | |
Highest Education Level | No Diploma | 800 | 13962 | 47075 |
Diploma or GED | 1359 | 13019 | 42138 | |
Some College | 1099 | 9679 | 26885 | |
Assoc. Degree | 375 | 3246 | 7671 | |
Bachelors Degree | 2664 | 14988 | 29983 | |
Higher Degree | 1540 | 10227 | 18815 | |
Total Housing Units | 5,454 | 43,508 | 106,945 | |
--Owner-Occupied | 2,354 | 18,280 | 49,411 | |
--Renter-Occupied | 2,249 | 19,576 | 45,576 | |
Owner-Occupied Values | < 100K | 113 | 5036 | 16920 |
100-199K | 286 | 3603 | 14671 | |
200-299K | 529 | 2525 | 5157 | |
300-399K | 487 | 2169 | 3842 | |
400-499K | 446 | 1650 | 2619 | |
500K+ | 493 | 3296 | 6202 | |
Total Working Age Population | 8,790 | 83,227 | 215,119 | |
In Work Force | 5,607 | 49,177 | 133,374 | |
Not In Work Force | 3,183 | 34,050 | 81,745 | |
Workforce Employed | 5,419 | 46,569 | 125,649 | |
Workforce Unemployed | 185 | 2,501 | 7,548 | |
Civlian Workforce | 5,604 | 49,070 | 133,197 | |
Military Workforce | 3 | 106 | 177 | |
Total Households | 4,602 | 37,856 | 94,986 | |
Family Households | 2,341 | 20,209 | 58,145 | |
Non-Family Households | 2,262 | 17,647 | 36,841 | |
Married Couple | 1,970 | 14,448 | 38,910 | |
Other Family | 371 | 5,761 | 19,235 | |
Married w/Child | 878 | 5,900 | 17,254 | |
Single Male w/Child | 54 | 756 | 2,644 | |
Single Female w/Child | 127 | 2,083 | 7,021 |
Population Change Last Two Decades - Plus Projection
2000 | % | 2010 | % | 2020 | % | 2030 | |
---|---|---|---|---|---|---|---|
Texas | 20,851,820 | +21 | 25,145,561 | +18 | 29,677,668 | +18 | 34,894,452 |
Tarrant County | 1,446,219 | +25 | 1,809,034 | +19 | 2,143,755 | +17 | 2,507,170 |
Total Working Age Population:
Total Households:
Total Working Age Population:
Total Households:
Total Working Age Population:
Total Households: