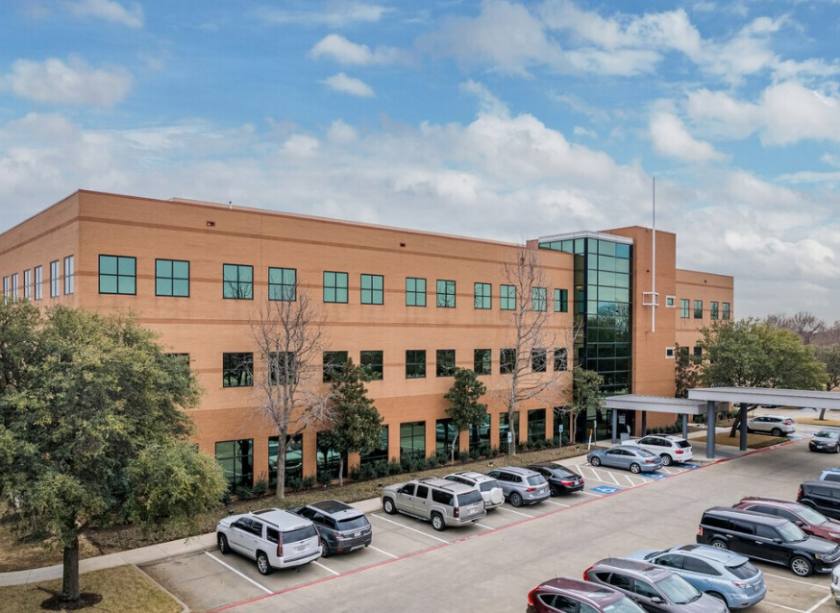
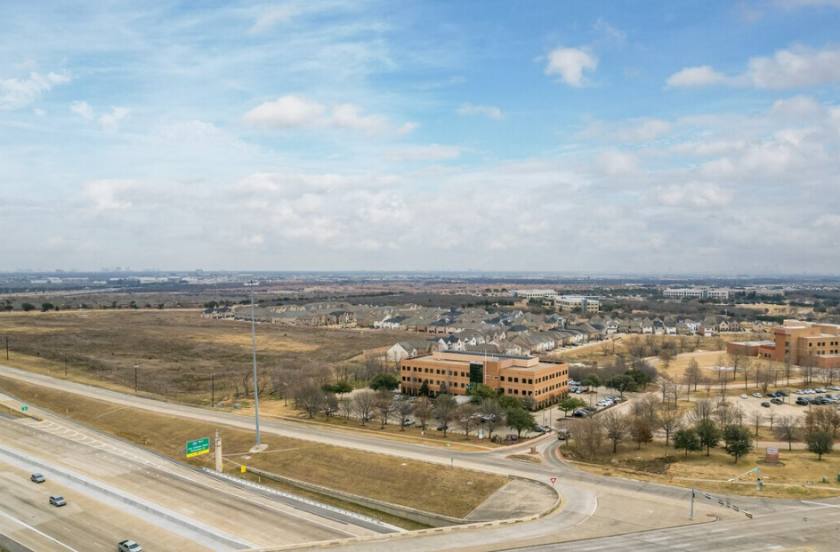
1-Mile | 3-Miles | 5-Miles | ||
---|---|---|---|---|
Total Population | 12,955 | 70,363 | 210,686 | |
Population Median Age | 32 | 32 | 34 | |
Population by Age | 0-9 Yrs | 2330 (17%) | 11700 (16%) | 31815 (15%) |
10-19 Yrs | 721 (5%) | 5979 (8%) | 25314 (12%) | |
20-29 Yrs | 2551 (19%) | 12494 (17%) | 34063 (16%) | |
30-39 Yrs | 3325 (25%) | 17427 (24%) | 40755 (19%) | |
40-49 Yrs | 1637 (12%) | 10172 (14%) | 29556 (14%) | |
50-59 Yrs | 1244 (9%) | 6673 (9%) | 24601 (11%) | |
60-69 Yrs | 906 (6%) | 4018 (5%) | 14370 (6%) | |
70+ Yrs | 241 (1%) | 1900 (2%) | 10212 (4%) | |
Median HH Income | $91,558 | $91,241 | $75,847 | |
Total Household Income | < 24K | 376 (6%) | 2295 (7%) | 8021 (9%) |
25-49K | 406 (7%) | 3689 (12%) | 15304 (19%) | |
50-74K | 1173 (21%) | 5168 (17%) | 16469 (20%) | |
75-99K | 1140 (21%) | 6109 (20%) | 12417 (15%) | |
100-199K | 1591 (29%) | 9343 (30%) | 20720 (25%) | |
200K+ | 735 (13%) | 3638 (12%) | 7499 (9%) | |
Highest Education Level | No Diploma | 219 | 1270 | 19656 |
Diploma or GED | 601 | 4501 | 22363 | |
Some College | 685 | 5644 | 21863 | |
Assoc. Degree | 694 | 2754 | 8283 | |
Bachelors Degree | 3927 | 19285 | 41463 | |
Higher Degree | 3212 | 15764 | 26919 | |
Total Housing Units | 6,070 | 33,396 | 87,014 | |
--Owner-Occupied | 1,414 | 7,649 | 30,119 | |
--Renter-Occupied | 4,007 | 22,592 | 50,311 | |
Owner-Occupied Values | < 100K | 15 | 187 | 1678 |
100-199K | 5 | 380 | 8309 | |
200-299K | 52 | 1350 | 6290 | |
300-399K | 352 | 2086 | 5524 | |
400-499K | 475 | 1761 | 4467 | |
500K+ | 515 | 1886 | 3851 | |
Total Working Age Population | 10,170 | 54,592 | 163,361 | |
In Work Force | 7,785 | 41,999 | 123,209 | |
Not In Work Force | 2,385 | 12,593 | 40,152 | |
Workforce Employed | 7,387 | 40,469 | 118,465 | |
Workforce Unemployed | 267 | 1,340 | 4,525 | |
Civlian Workforce | 7,654 | 41,809 | 122,990 | |
Military Workforce | 131 | 189 | 219 | |
Total Households | 5,421 | 30,242 | 80,430 | |
Family Households | 3,549 | 17,768 | 51,936 | |
Non-Family Households | 1,872 | 12,474 | 28,494 | |
Married Couple | 3,005 | 14,842 | 38,895 | |
Other Family | 545 | 2,926 | 13,042 | |
Married w/Child | 1,410 | 7,906 | 19,619 | |
Single Male w/Child | 102 | 400 | 1,660 | |
Single Female w/Child | 205 | 1,369 | 5,093 |
Population Change Last Two Decades - Plus Projection
2000 | % | 2010 | % | 2020 | % | 2030 | |
---|---|---|---|---|---|---|---|
Texas | 20,851,820 | +21 | 25,145,561 | +18 | 29,677,668 | +18 | 34,894,452 |
Tarrant County | 1,446,219 | +25 | 1,809,034 | +19 | 2,143,755 | +17 | 2,507,170 |
Dallas County | 2,218,899 | +7 | 2,368,139 | +15 | 2,734,111 | +14 | 3,106,298 |
Total Working Age Population:
Total Households:
Total Working Age Population:
Total Households:
Total Working Age Population:
Total Households: