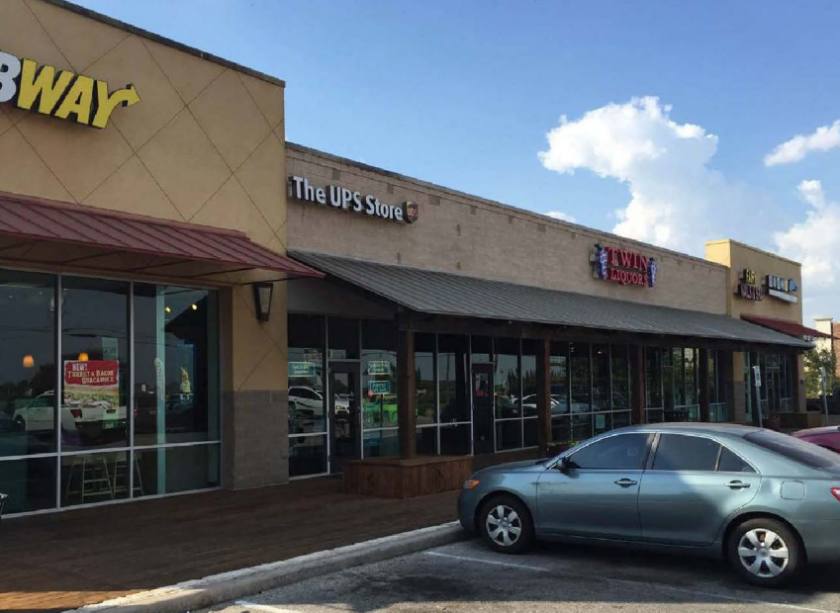
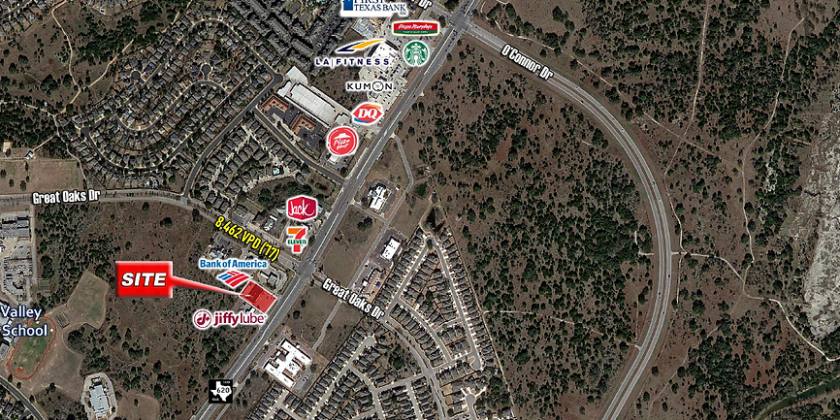
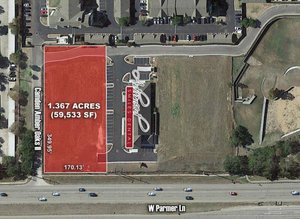
1-Mile | 3-Miles | 5-Miles | ||
---|---|---|---|---|
Total Population | 7,902 | 67,720 | 227,747 | |
Population Median Age | 33 | 35 | 35 | |
Population by Age | 0-9 Yrs | 1325 (16%) | 9673 (14%) | 30357 (13%) |
10-19 Yrs | 1333 (16%) | 10166 (15%) | 31078 (13%) | |
20-29 Yrs | 705 (8%) | 8238 (12%) | 31792 (13%) | |
30-39 Yrs | 1460 (18%) | 10141 (14%) | 40235 (17%) | |
40-49 Yrs | 1406 (17%) | 11843 (17%) | 37939 (16%) | |
50-59 Yrs | 862 (10%) | 7943 (11%) | 26375 (11%) | |
60-69 Yrs | 516 (6%) | 5692 (8%) | 17514 (7%) | |
70+ Yrs | 295 (3%) | 4026 (5%) | 12456 (5%) | |
Median HH Income | $97,388 | $98,088 | $83,921 | |
Total Household Income | < 24K | 110 (4%) | 1736 (7%) | 8124 (9%) |
25-49K | 289 (11%) | 3171 (13%) | 14258 (17%) | |
50-74K | 574 (22%) | 3858 (17%) | 15542 (18%) | |
75-99K | 346 (13%) | 2794 (12%) | 10730 (12%) | |
100-199K | 884 (34%) | 7945 (35%) | 26868 (32%) | |
200K+ | 363 (14%) | 3188 (14%) | 7986 (9%) | |
Highest Education Level | No Diploma | 123 | 2026 | 8617 |
Diploma or GED | 609 | 5959 | 24656 | |
Some College | 1024 | 8121 | 31569 | |
Assoc. Degree | 506 | 3788 | 12098 | |
Bachelors Degree | 1553 | 15222 | 50096 | |
Higher Degree | 1048 | 8749 | 27112 | |
Total Housing Units | 2,620 | 23,810 | 89,813 | |
--Owner-Occupied | 1,700 | 13,994 | 42,543 | |
--Renter-Occupied | 867 | 8,698 | 40,966 | |
Owner-Occupied Values | < 100K | 20 | 281 | 832 |
100-199K | 171 | 1509 | 5920 | |
200-299K | 504 | 3748 | 13209 | |
300-399K | 627 | 3957 | 11952 | |
400-499K | 245 | 2521 | 6786 | |
500K+ | 133 | 1979 | 3844 | |
Total Working Age Population | 5,615 | 51,226 | 177,873 | |
In Work Force | 4,272 | 37,169 | 133,371 | |
Not In Work Force | 1,343 | 14,058 | 44,502 | |
Workforce Employed | 4,040 | 35,640 | 127,301 | |
Workforce Unemployed | 191 | 1,464 | 5,914 | |
Civlian Workforce | 4,231 | 37,104 | 133,215 | |
Military Workforce | 41 | 65 | 156 | |
Total Households | 2,566 | 22,692 | 83,509 | |
Family Households | 1,811 | 15,898 | 53,686 | |
Non-Family Households | 755 | 6,794 | 29,823 | |
Married Couple | 1,508 | 13,133 | 41,712 | |
Other Family | 303 | 2,765 | 11,974 | |
Married w/Child | 983 | 7,508 | 22,583 | |
Single Male w/Child | 38 | 557 | 1,673 | |
Single Female w/Child | 201 | 1,240 | 4,959 |
Population Change Last Two Decades - Plus Projection
2000 | % | 2010 | % | 2020 | % | 2030 | |
---|---|---|---|---|---|---|---|
Texas | 20,851,820 | +21 | 25,145,561 | +18 | 29,677,668 | +18 | 34,894,452 |
Travis County | 812,280 | +26 | 1,024,266 | +26 | 1,291,502 | +19 | 1,540,812 |
Williamson County | 249,967 | +69 | 422,679 | +40 | 589,914 | +41 | 830,421 |
Total Working Age Population:
Total Households:
Total Working Age Population:
Total Households:
Total Working Age Population:
Total Households: