Commercial Land
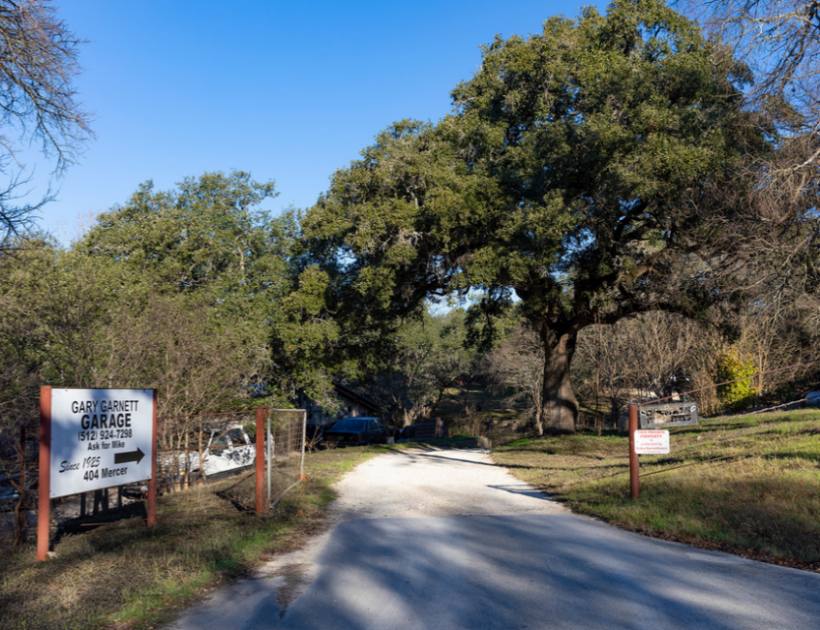
404 Mercer Street Dripping Springs, TX 78620
404 Mercer Street Dripping Springs, TX 78620

Details & Description
Property Highlights
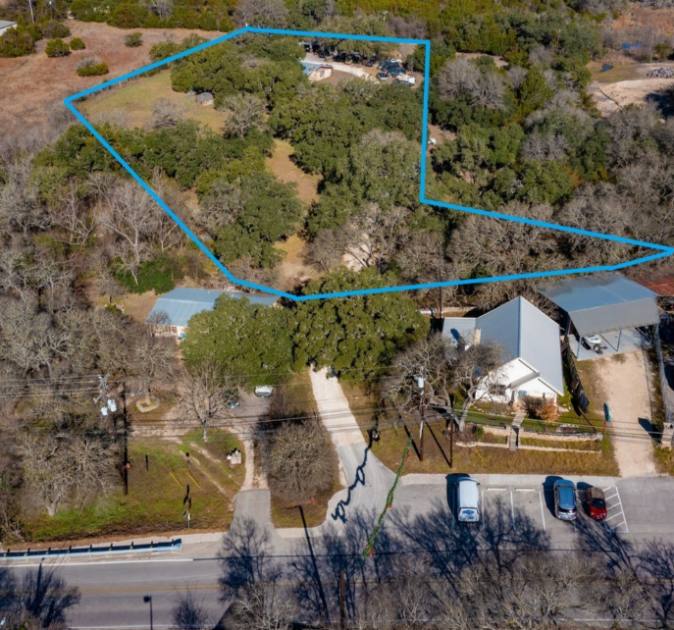
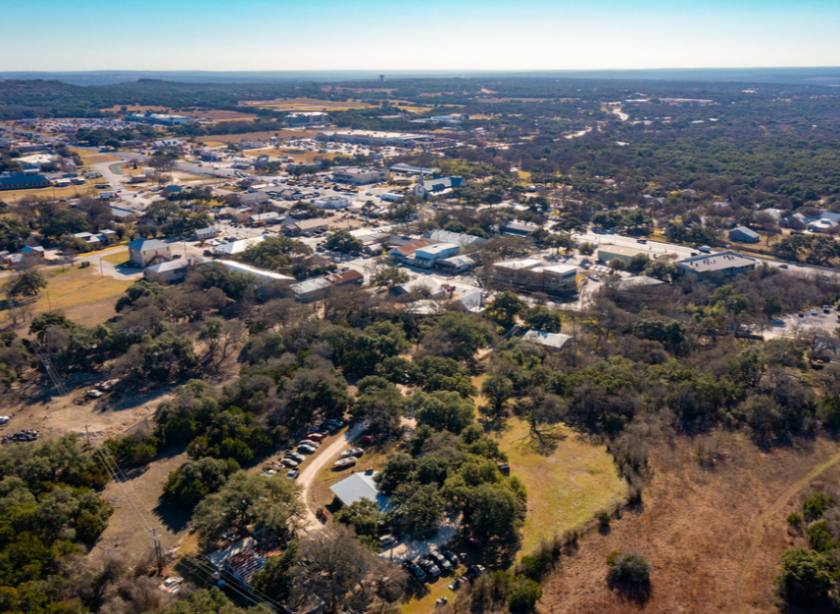
• Close to Hwy 290/RR 12 intersection for easy transportation access
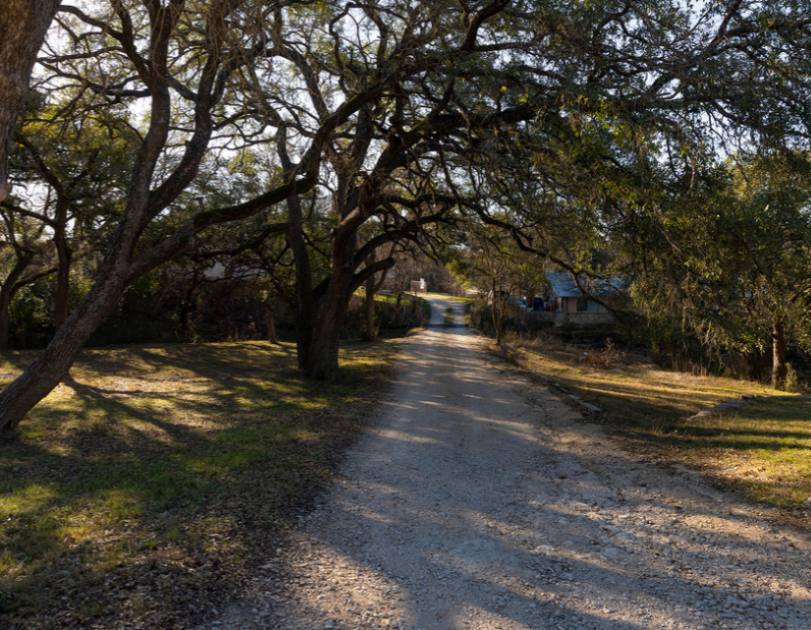
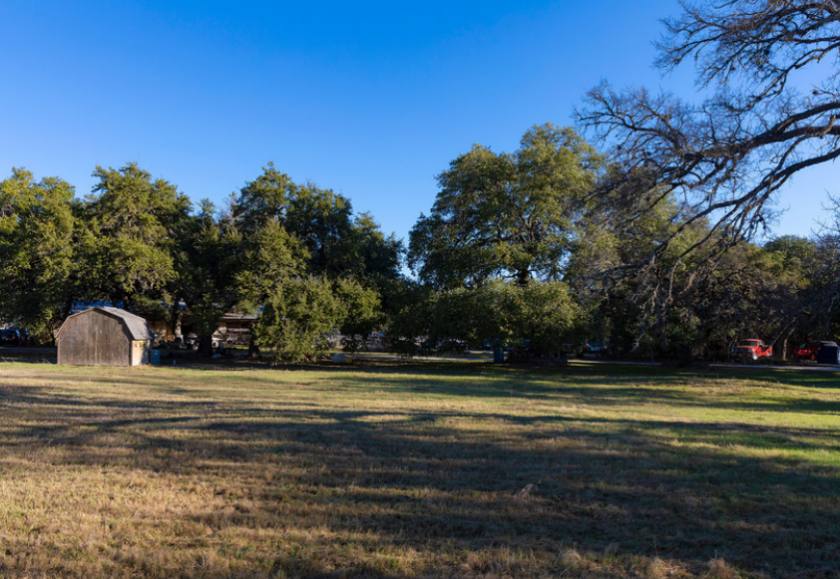
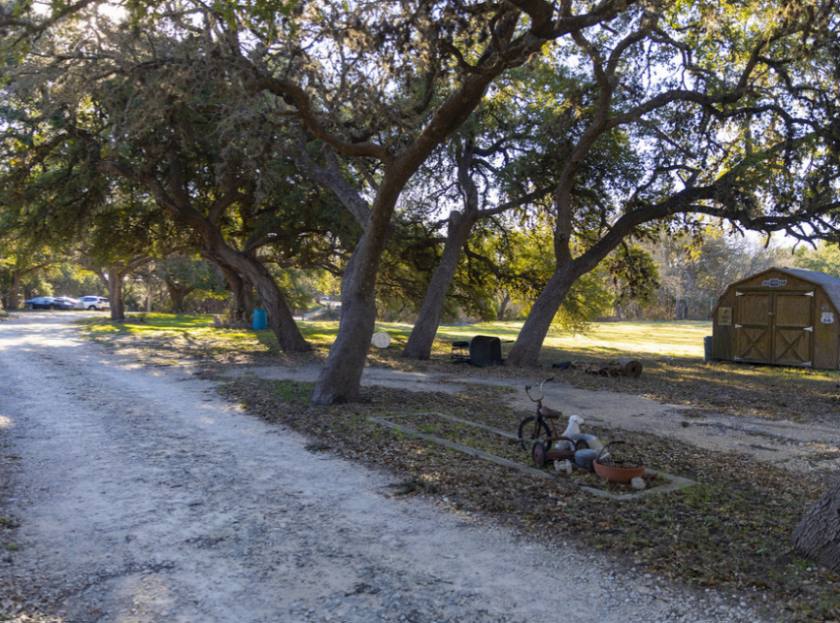
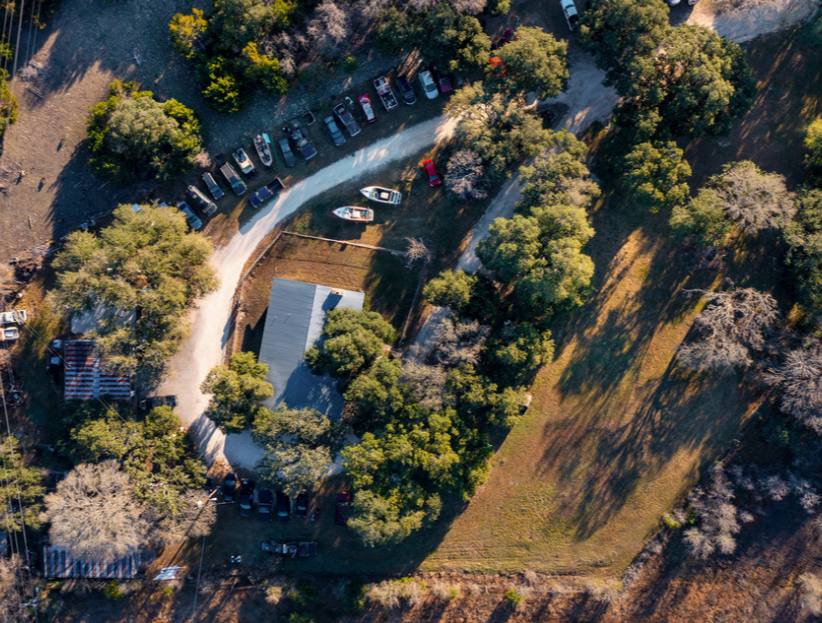
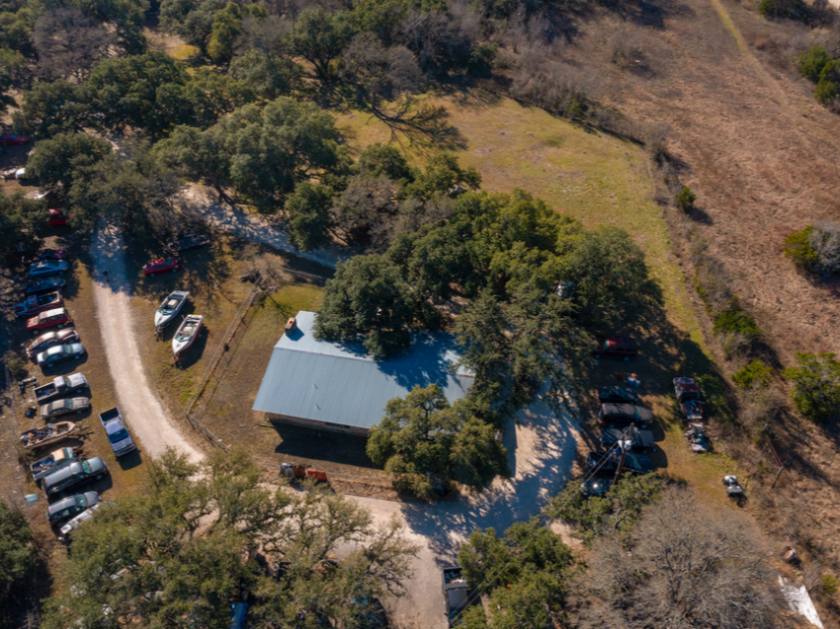
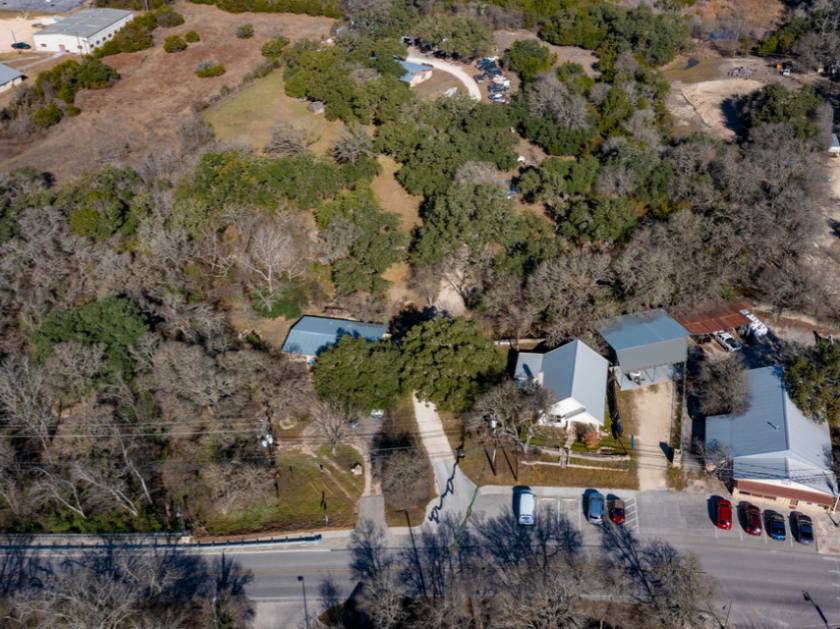
• Landscape of beautiful mature oak trees and open field
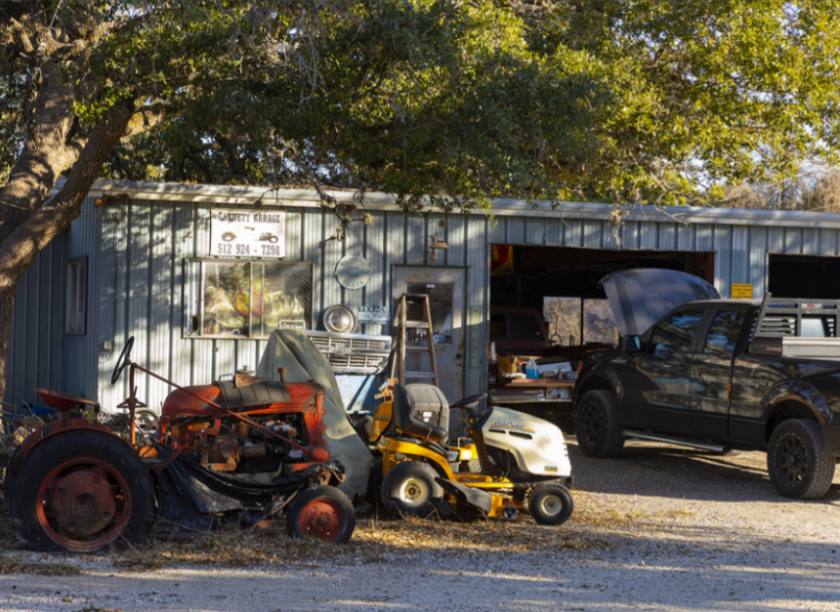
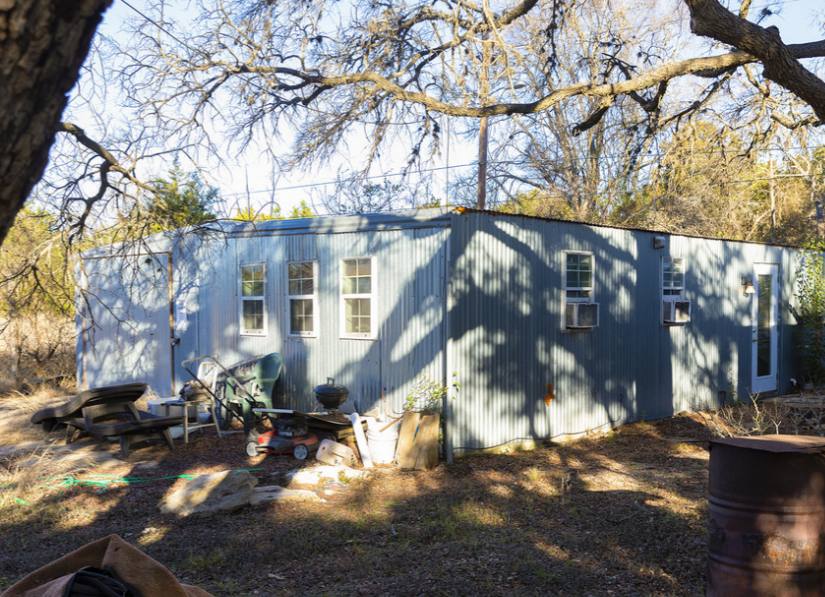
Additional Photos
Listing Agents

Nick Boyd
O: 512-213-4177
M: 512-838-1087
nick.r.boyd@gmail.com
O: 512-213-4177
M: 512-838-1087
nick.r.boyd@gmail.com
While we strive to provide the most accurate information, all listing information, and demographic data, is provided by third-parties. As such, MyEListing will not be responsible for the accuracy of the information. It is strongly recommended that you verify all information with the listing agent, and any relevant agencies, prior to making any decisions.