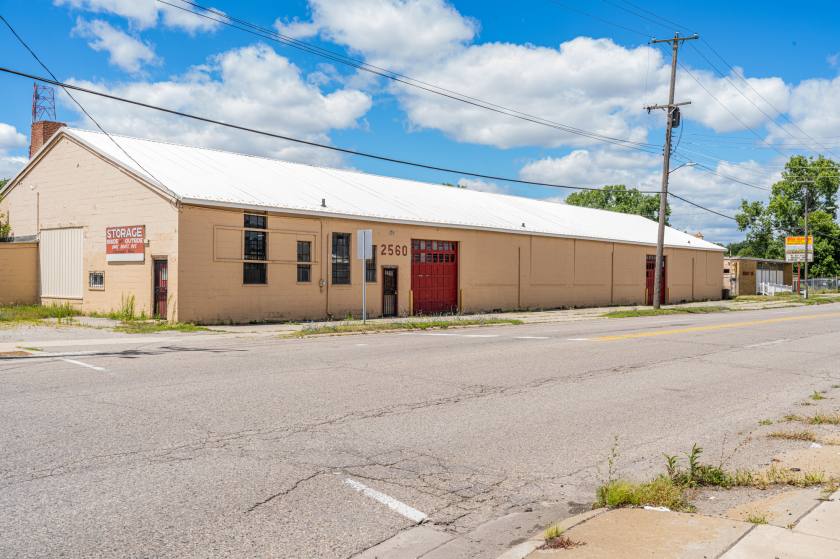
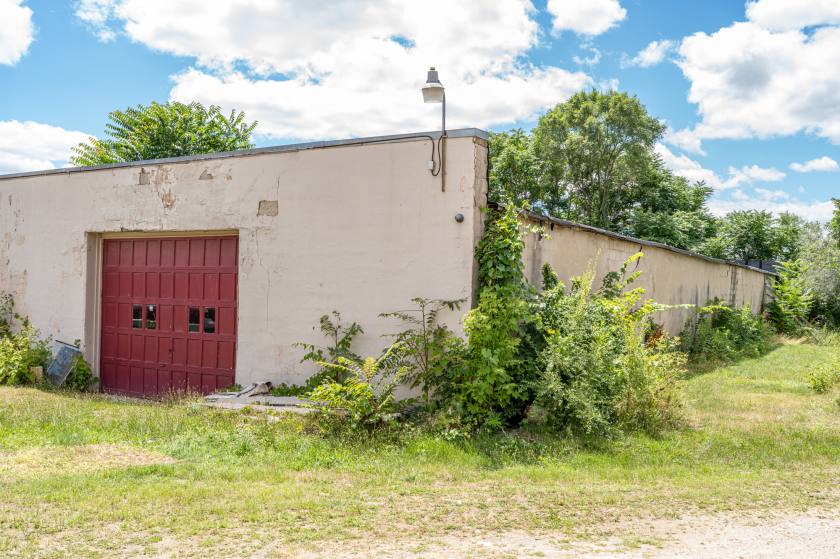
Industrial Properties
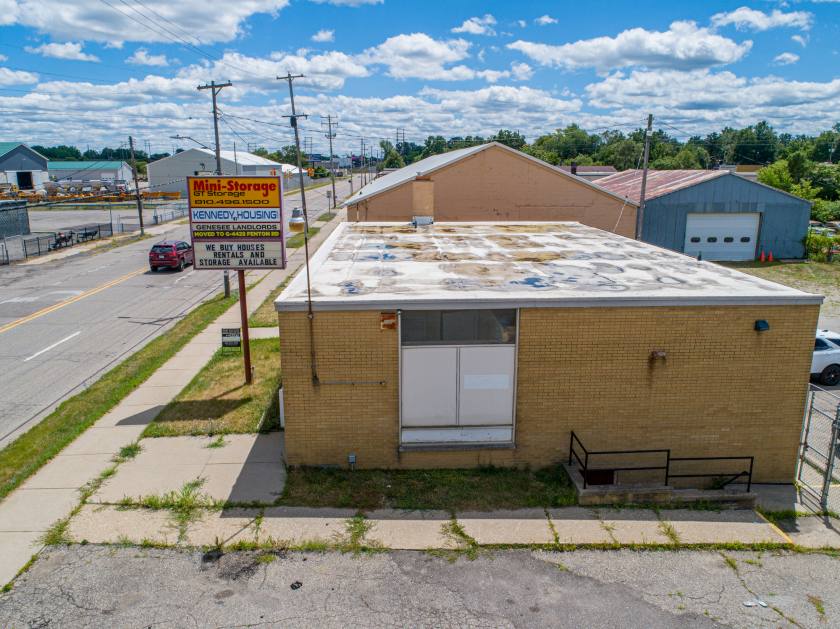
2540 South Grand Traverse Street Flint, MI 48503
2540 South Grand Traverse Street Flint, MI 48503

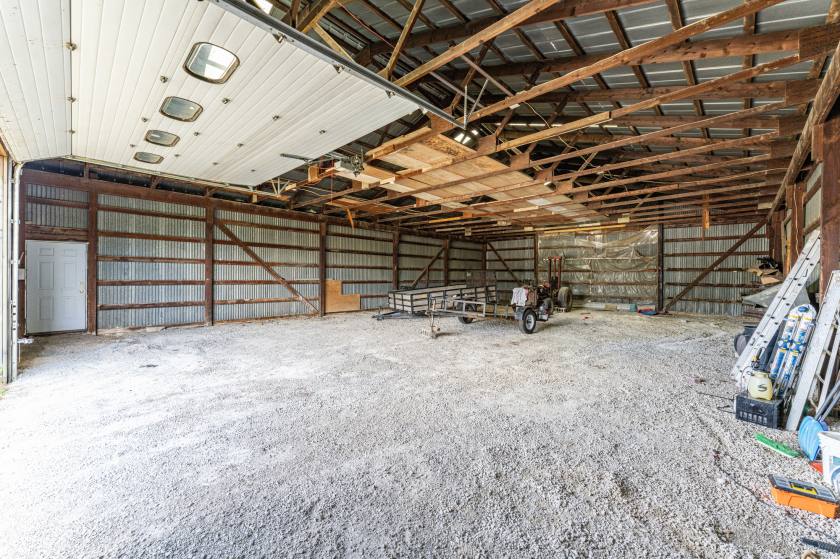
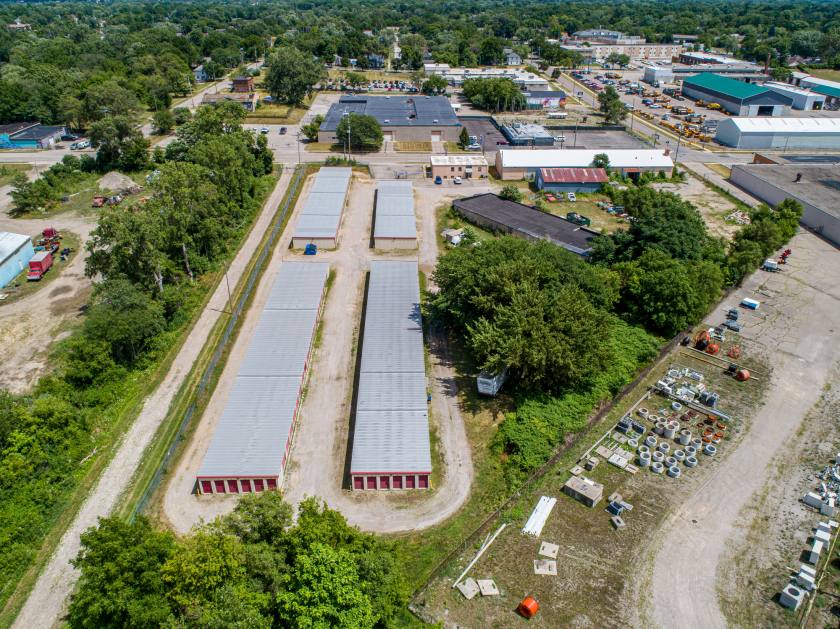
Details & Description
Property Highlights
• Less than 5 miles from major retailers such as Home Depot
• Hard lighted corner at S Grand Traverse St and Oakley St
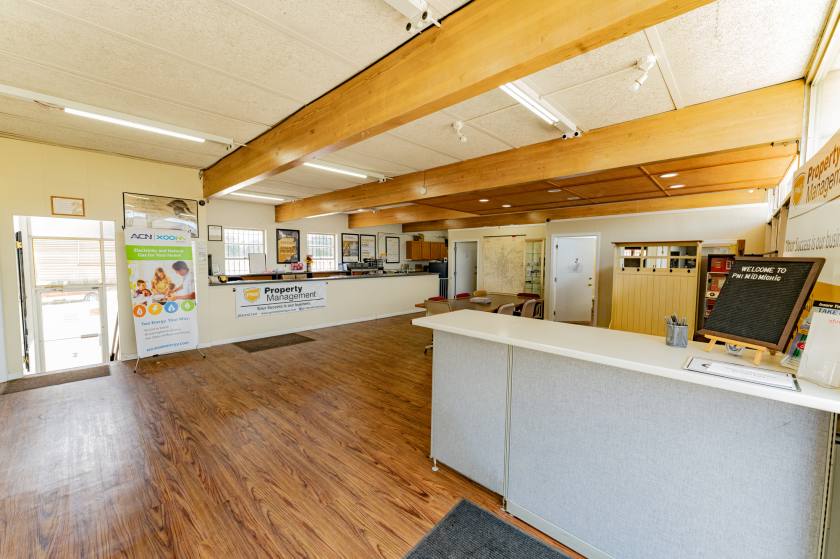
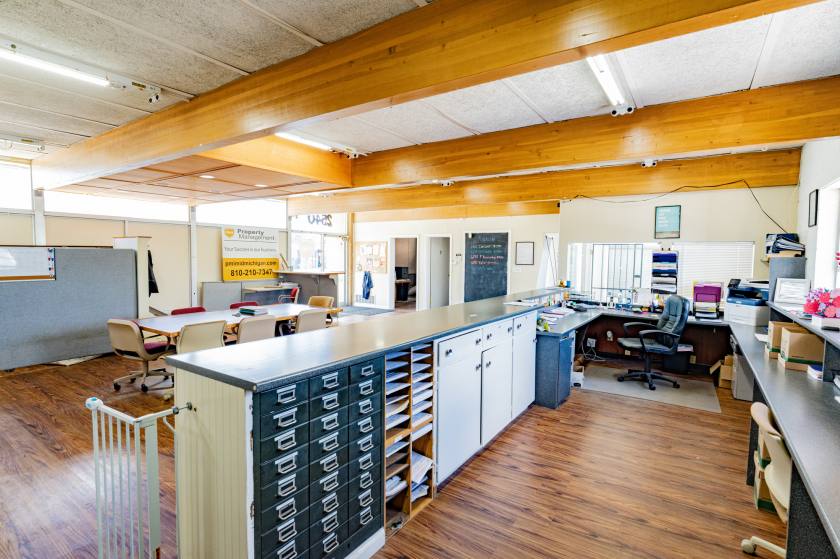
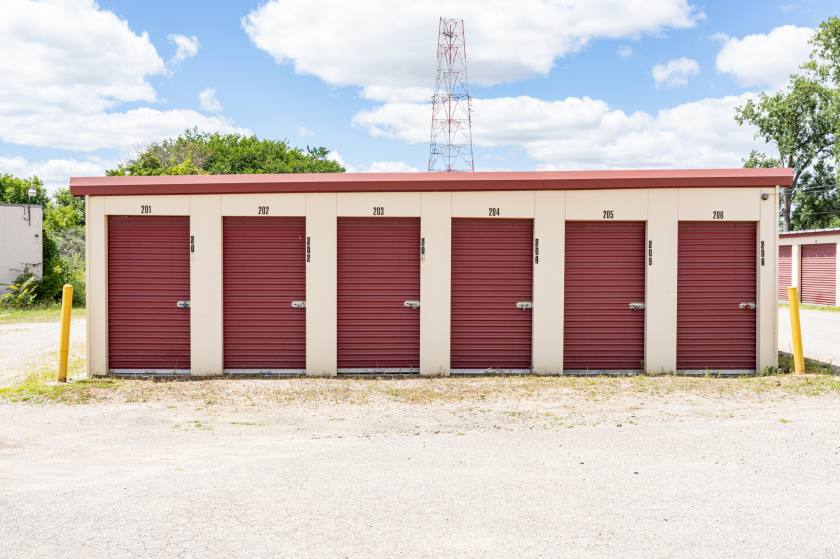
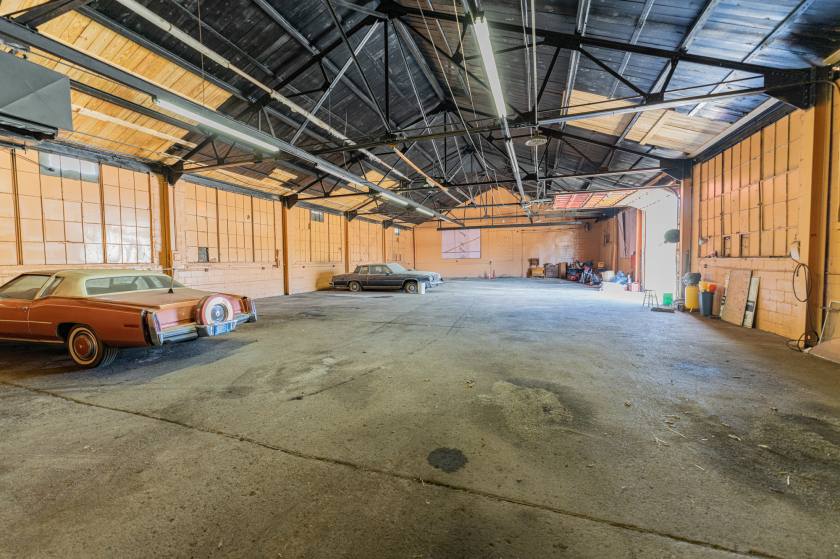
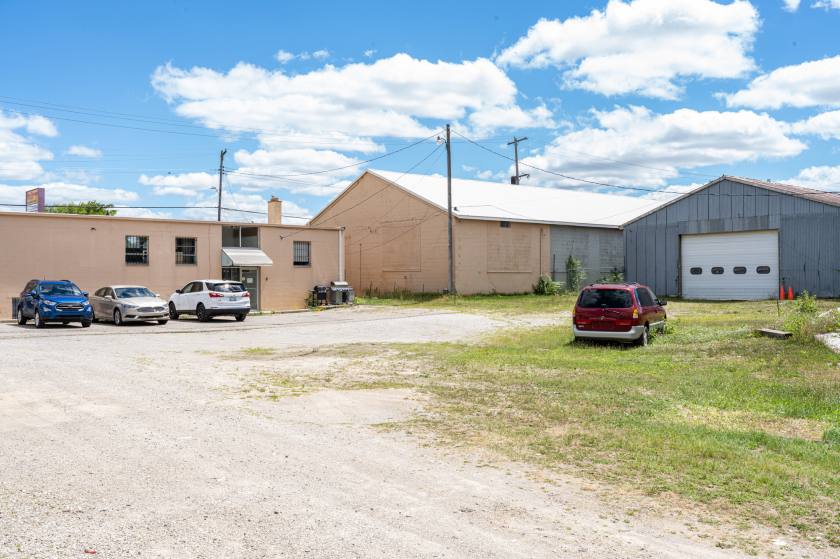
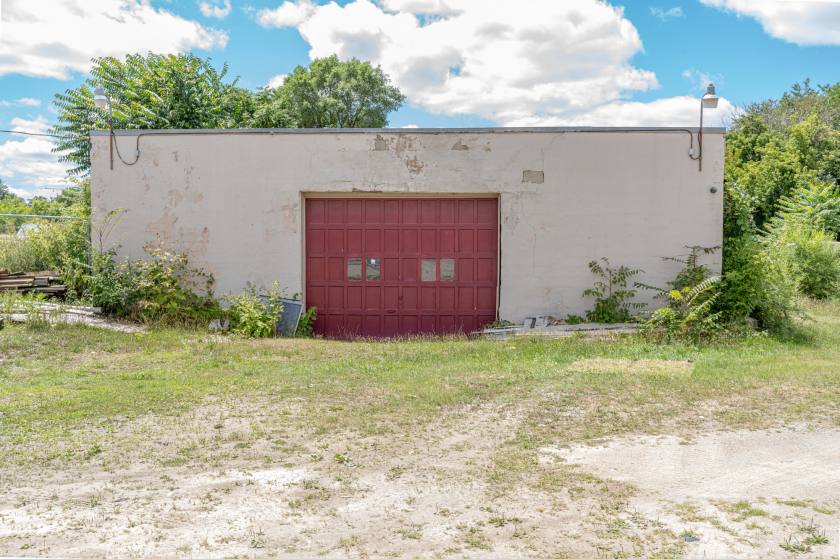
Additional Photos


Listing Agents

Kristen Asman
O: 614-370-9077
kristen.asman@svn.com
O: 614-370-9077
kristen.asman@svn.com
While we strive to provide the most accurate information, all listing information, and demographic data, is provided by third-parties. As such, MyEListing will not be responsible for the accuracy of the information. It is strongly recommended that you verify all information with the listing agent, and any relevant agencies, prior to making any decisions.