Commercial Land
E Loop 1604 and Lower Seguin Rd Converse, TX 78109
E Loop 1604 and Lower Seguin Rd Converse, TX 78109
Details & Description
Property Highlights
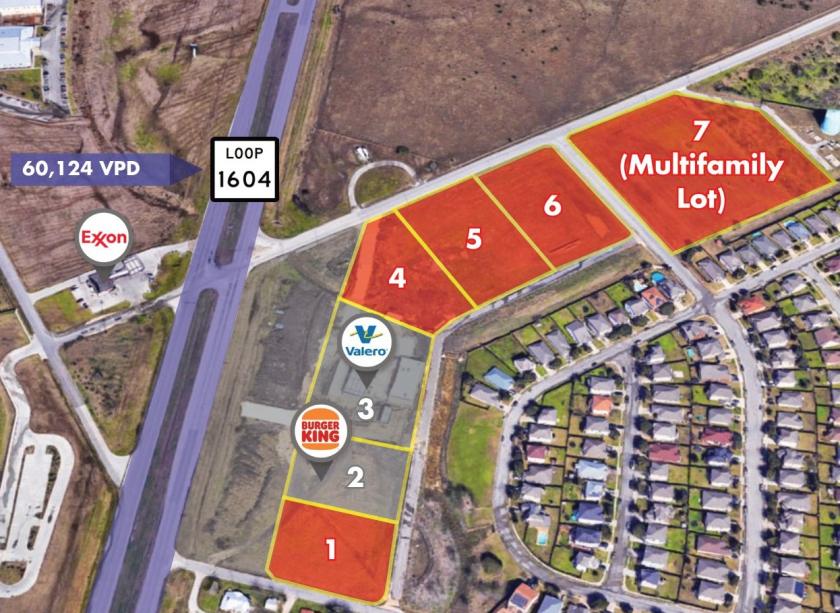
- • Easy access to E Loop 1604 & IH-10
- • Excellent traffic counts around the parcels
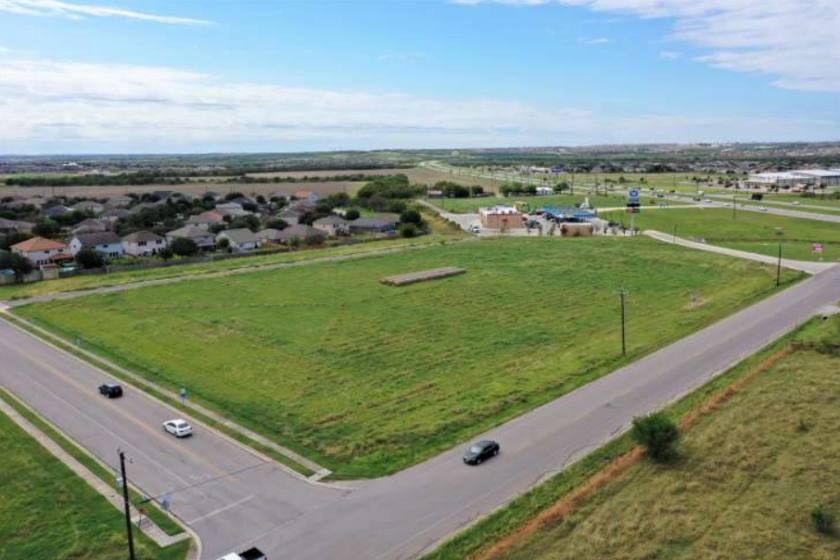
- • Outstanding visibility
- • Development Ready!
- • Ideal for retail or office purposes
- • Conceptual site plan available
Additional Photos


Listing Agents

Matthew Baylor
O: 210-222-2424
M: 210-381-3398
mbaylor@dhrp.us
O: 210-222-2424
M: 210-381-3398
mbaylor@dhrp.us
While we strive to provide the most accurate information, all listing information, and demographic data, is provided by third-parties. As such, MyEListing will not be responsible for the accuracy of the information. It is strongly recommended that you verify all information with the listing agent, and any relevant agencies, prior to making any decisions.