Industrial Properties
1120 West Howard Lane Austin, TX 78753
1120 West Howard Lane Austin, TX 78753

Details & Description
Property Highlights
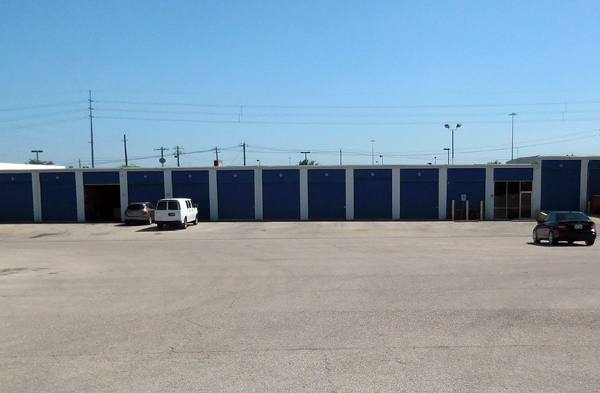
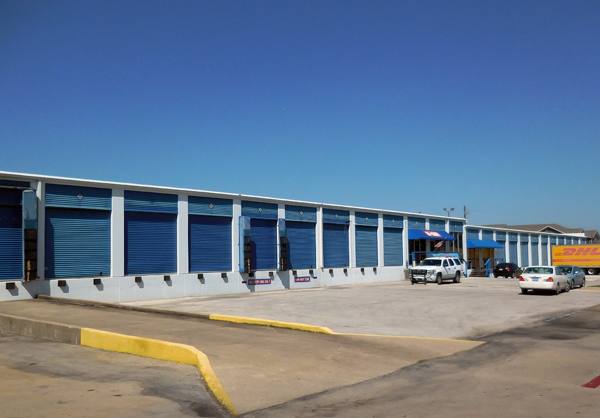
- • Two grade-level doors
- • Two dock-high doors
- • Close to Howard Ln., Lamar, and IH-35
- • Accommodates a variety of space needs
Additional Photos

Listing Agents

Eric Layne
O: 512-252-9900
eric@laynecompany.com
O: 512-252-9900
eric@laynecompany.com
While we strive to provide the most accurate information, all listing information, and demographic data, is provided by third-parties. As such, MyEListing will not be responsible for the accuracy of the information. It is strongly recommended that you verify all information with the listing agent, and any relevant agencies, prior to making any decisions.


