Industrial Properties
404 West Powell Lane Austin, TX 78753
404 West Powell Lane Austin, TX 78753

Details & Description
Property Highlights
• $0.69 SF SF/MO Base Rent + $0.29 SF/MO NNN ($4,488.40 per month)
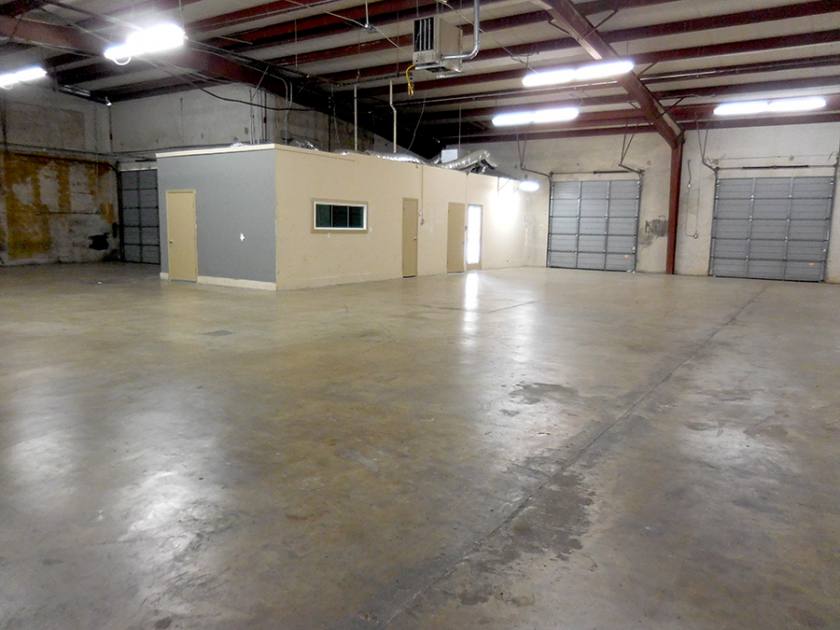
• No. Drive In / Grade-Level Doors: 1
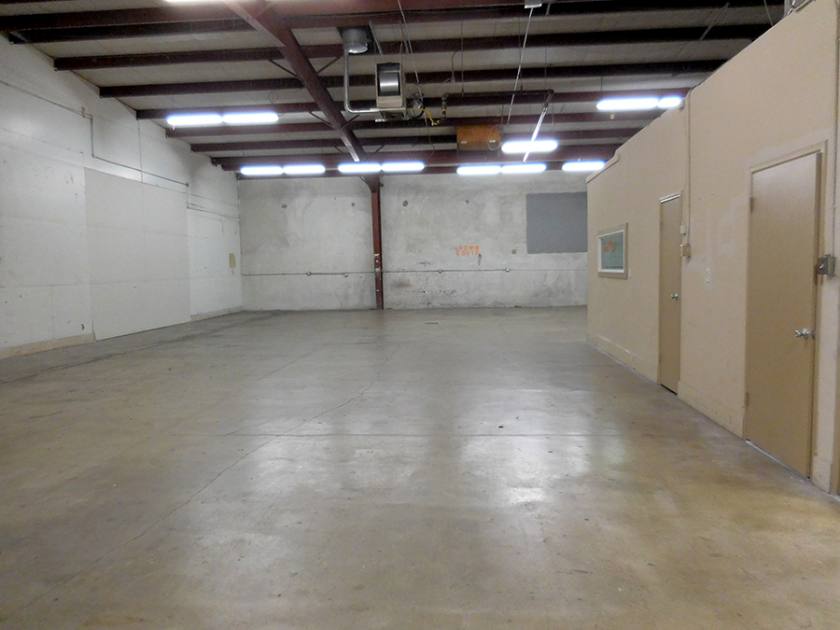
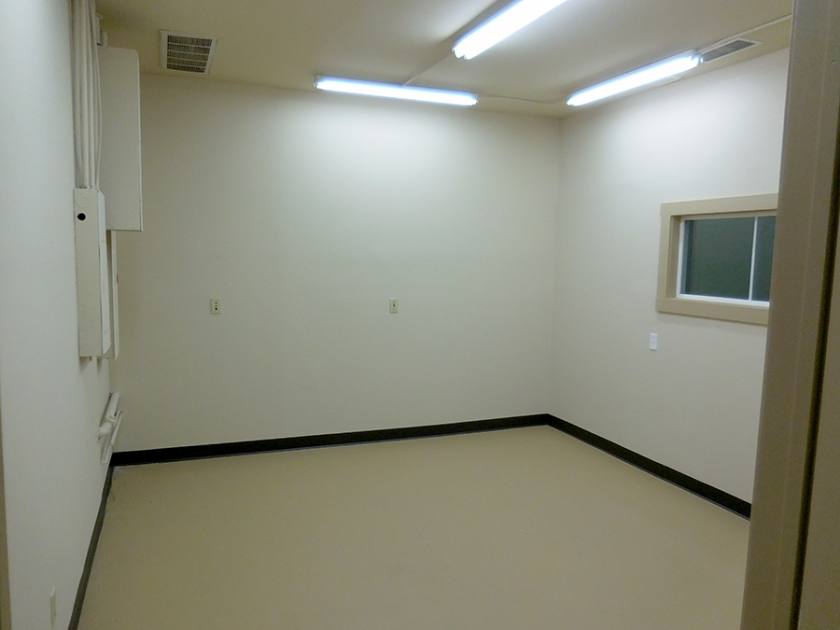
Additional Photos


Listing Agents

Eric Layne
O: 512-252-9900
eric@laynecompany.com
O: 512-252-9900
eric@laynecompany.com
While we strive to provide the most accurate information, all listing information, and demographic data, is provided by third-parties. As such, MyEListing will not be responsible for the accuracy of the information. It is strongly recommended that you verify all information with the listing agent, and any relevant agencies, prior to making any decisions.