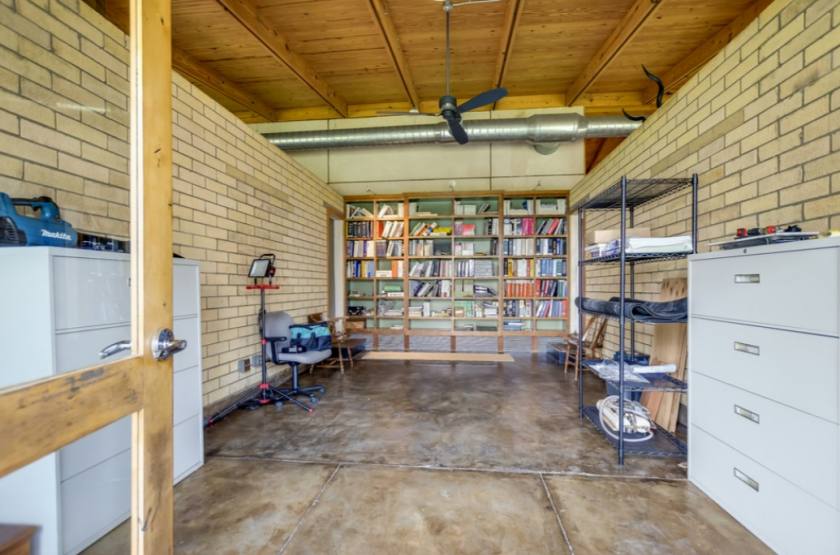
Office Space
4942 U.S. 290 Austin, TX 78735
4942 U.S. 290 Austin, TX 78735

Details & Description
Property Highlights
- • Owner / User or Investment Opportunity
- • High-end architectural design
- • Direct Access to Greenbelt
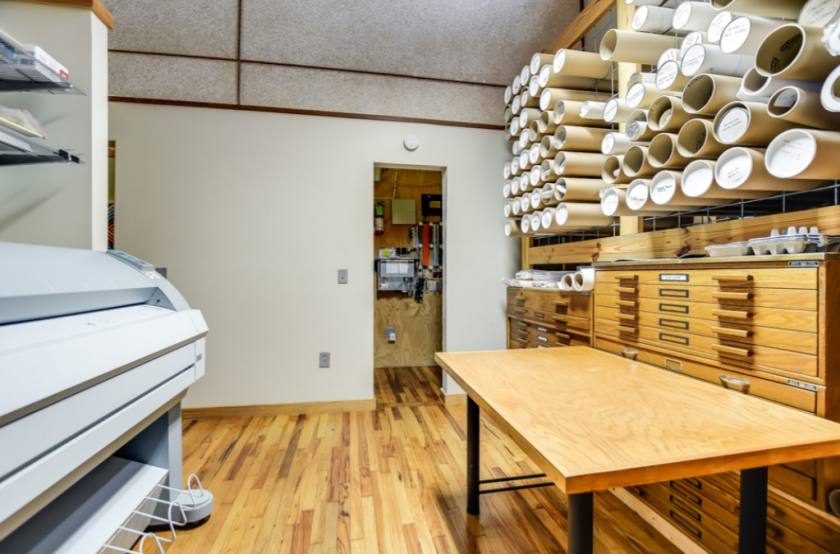
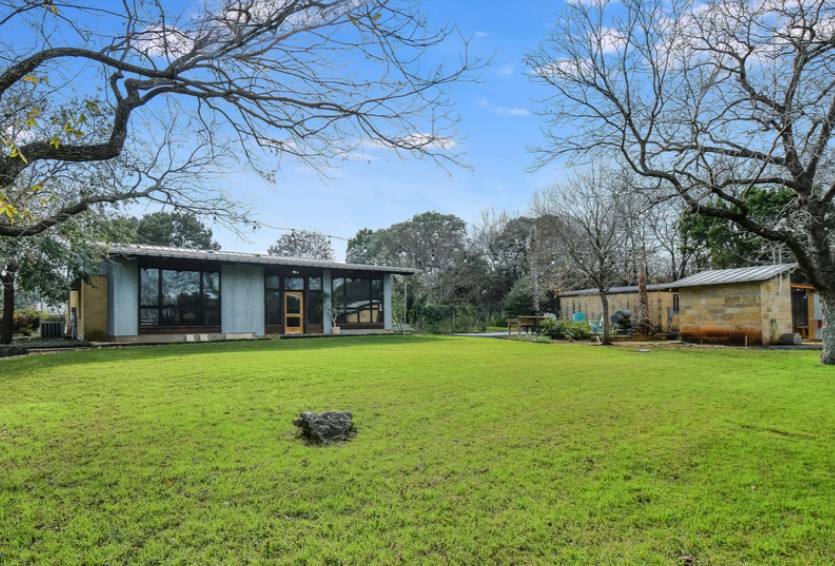
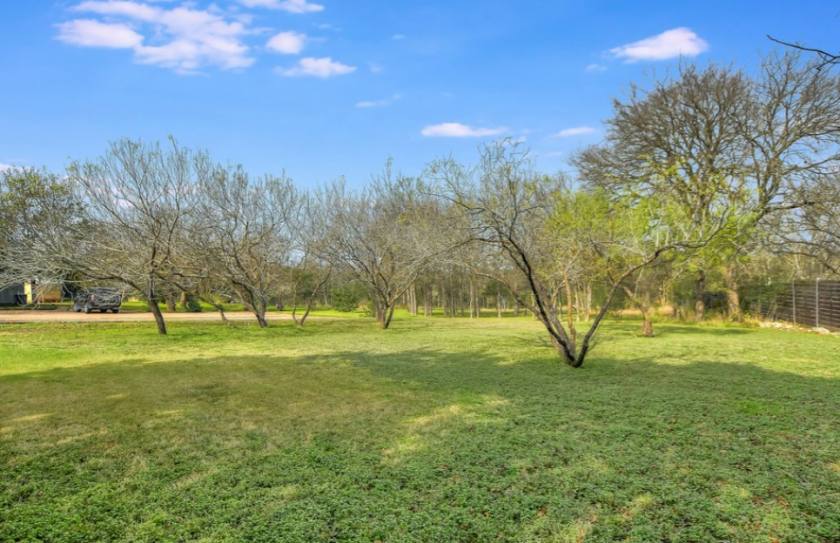
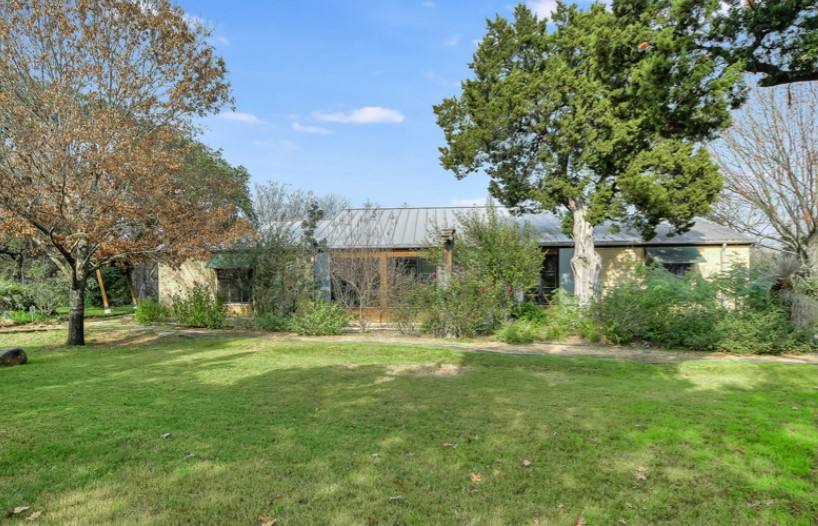
Additional Photos


Listing Agents

Perry Horton
O: 512-467-2222
M: 512-415-4565
perry@leadcommercial.com
O: 512-467-2222
M: 512-415-4565
perry@leadcommercial.com

Tim Mooney
O: 512-467-2222
M: 512-658-4916
tim@leadcommercial.com
O: 512-467-2222
M: 512-658-4916
tim@leadcommercial.com
While we strive to provide the most accurate information, all listing information, and demographic data, is provided by third-parties. As such, MyEListing will not be responsible for the accuracy of the information. It is strongly recommended that you verify all information with the listing agent, and any relevant agencies, prior to making any decisions.