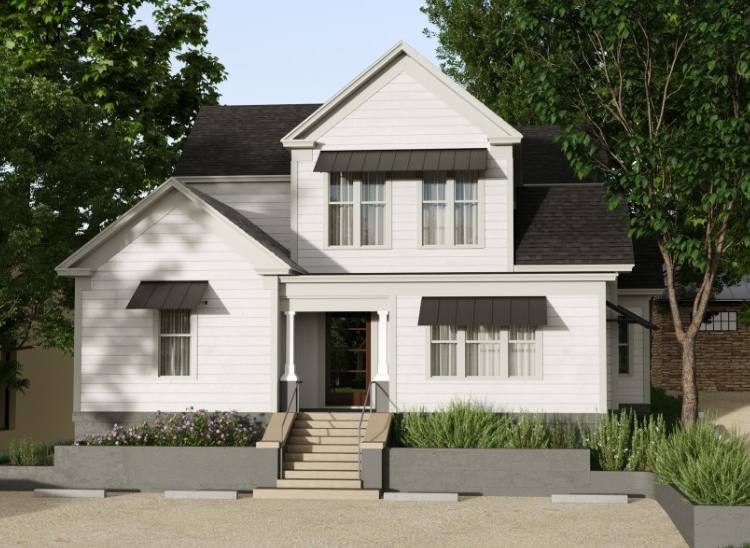
Office Space
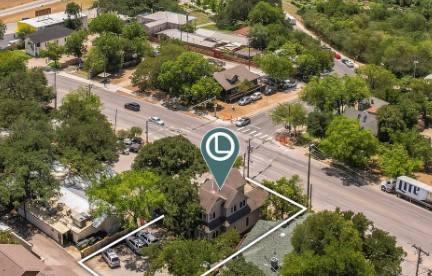
2306 Lake Austin Boulevard Austin, TX 78703
2306 Lake Austin Boulevard Austin, TX 78703
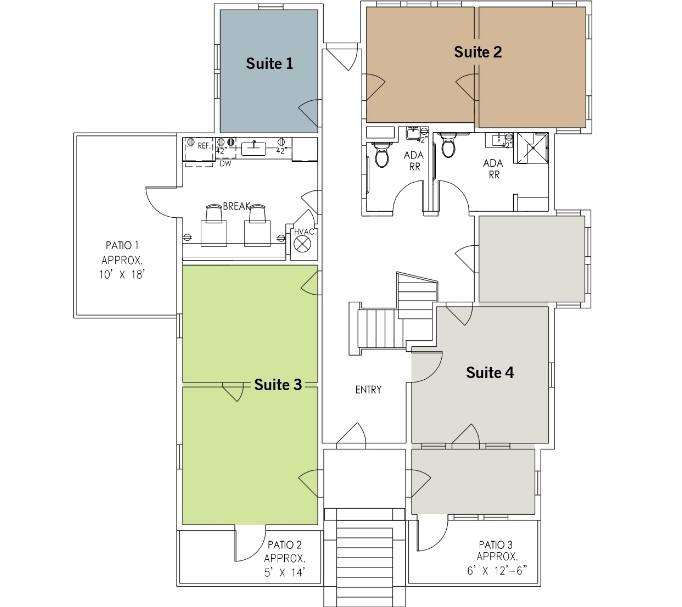
Details & Description
Additional Photos

Listing Agents

Tim Mooney
O: 512-467-2222
M: 512-658-4916
tim@leadcommercial.com
O: 512-467-2222
M: 512-658-4916
tim@leadcommercial.com
While we strive to provide the most accurate information, all listing information, and demographic data, is provided by third-parties. As such, MyEListing will not be responsible for the accuracy of the information. It is strongly recommended that you verify all information with the listing agent, and any relevant agencies, prior to making any decisions.


