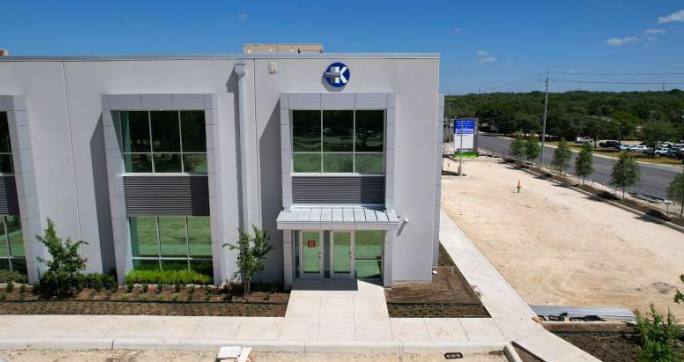
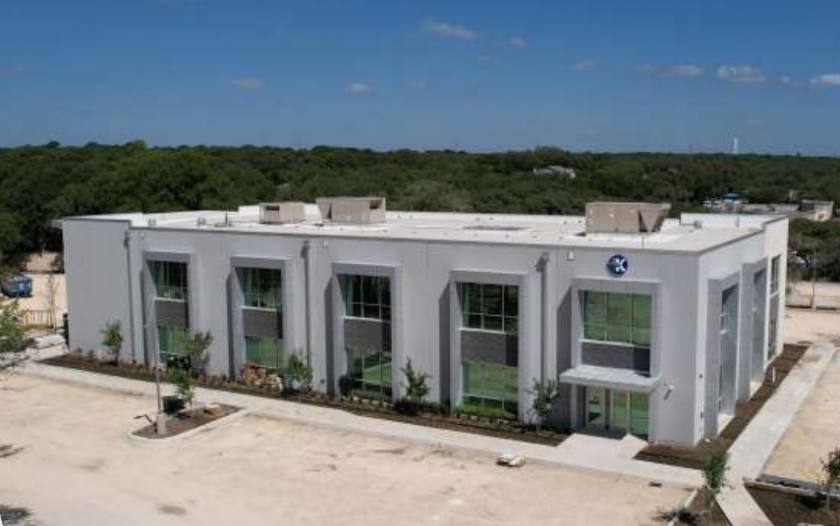
Office Space
3701 Farm to Market Road 3009 Schertz, TX 78154
3701 Farm to Market Road 3009 Schertz, TX 78154
Details & Description
Property Highlights
• The City of Schertz is considered one of the most vibrant growth regions in the San Antonio Metropolitan area
• The City of Schertz is considered one of the most vibrant growth regions in the San Antonio Metropolitan area
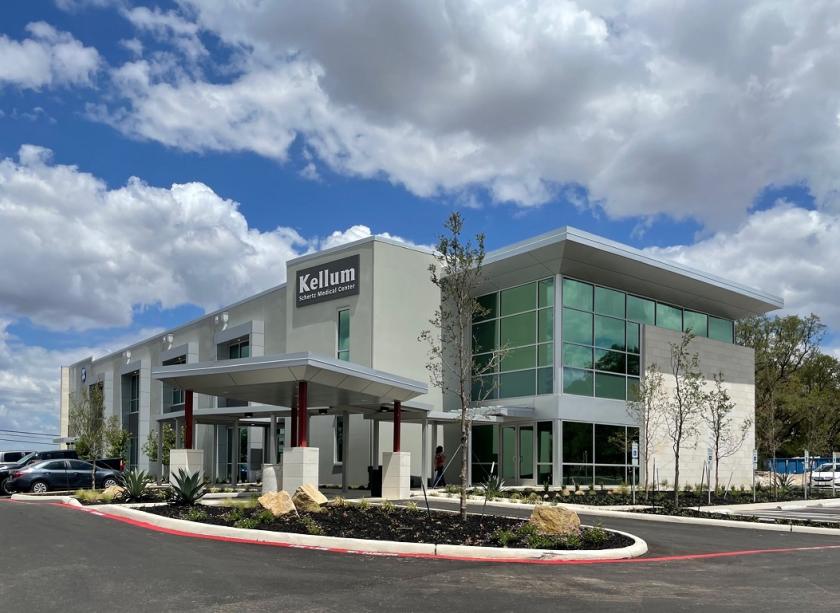
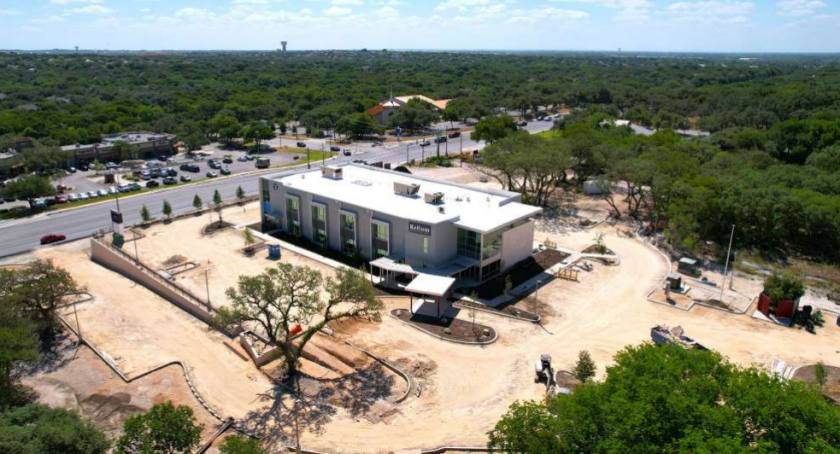
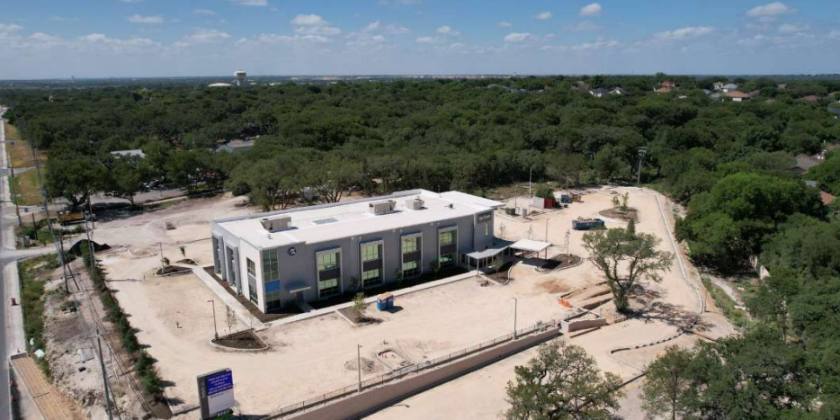
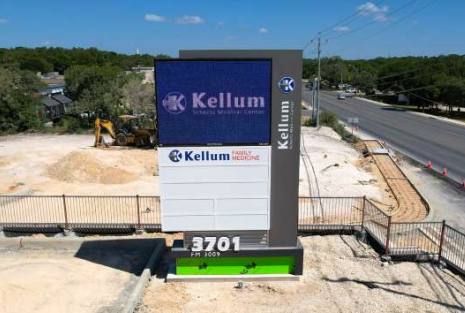
Additional Photos
Listing Agents

Darrell Keller
O: 210-222-2424
M: 210-317-9024
dkeller@dhrp.us
O: 210-222-2424
M: 210-317-9024
dkeller@dhrp.us
While we strive to provide the most accurate information, all listing information, and demographic data, is provided by third-parties. As such, MyEListing will not be responsible for the accuracy of the information. It is strongly recommended that you verify all information with the listing agent, and any relevant agencies, prior to making any decisions.