Office Space
2525 Wallingwood Drive Austin, TX 78746
2525 Wallingwood Drive Austin, TX 78746

Details & Description
Property Highlights
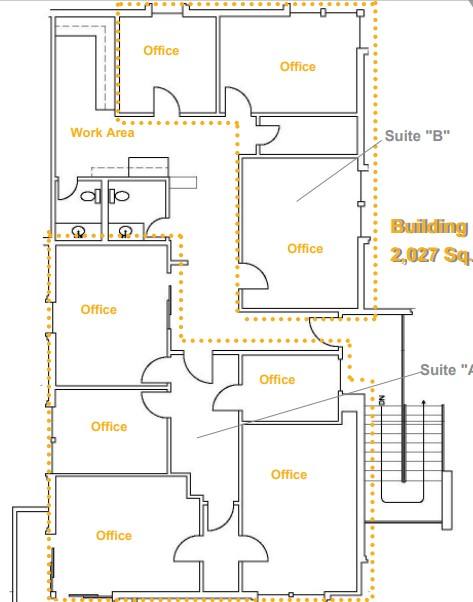
• Use: The space is perfect for professional business services, counselling or other light office use
• Availability: Suite "A" August 1, 2021, and Suite "B" September 1, 2021
Listing Agents

Robert Hemphill
O: 512-474-2224
robertrhemphill@austin.rr.com
O: 512-474-2224
robertrhemphill@austin.rr.com
While we strive to provide the most accurate information, all listing information, and demographic data, is provided by third-parties. As such, MyEListing will not be responsible for the accuracy of the information. It is strongly recommended that you verify all information with the listing agent, and any relevant agencies, prior to making any decisions.