Office Space
704 East Wonsley Drive Austin, TX 78753
704 East Wonsley Drive Austin, TX 78753

Details & Description
Property Highlights
• Lease Rate: First year rate is $16.00 per sq. ft. NNN.
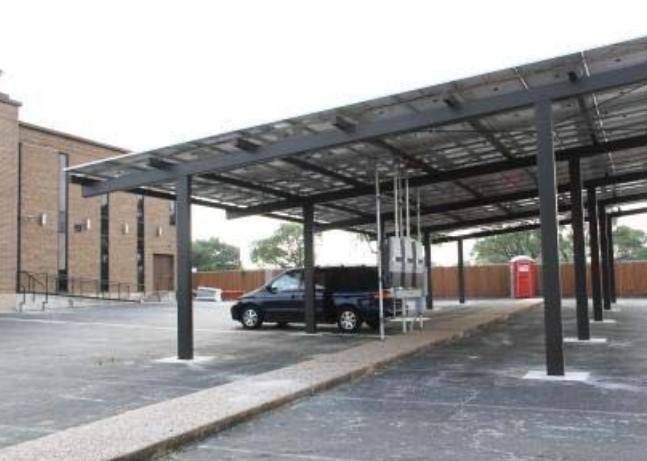
• Parking: 3.7 spaces per 1,000 sq. ft, surface/covered
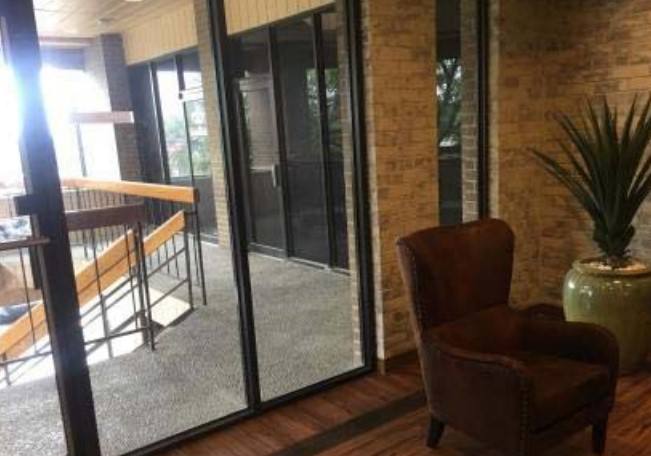
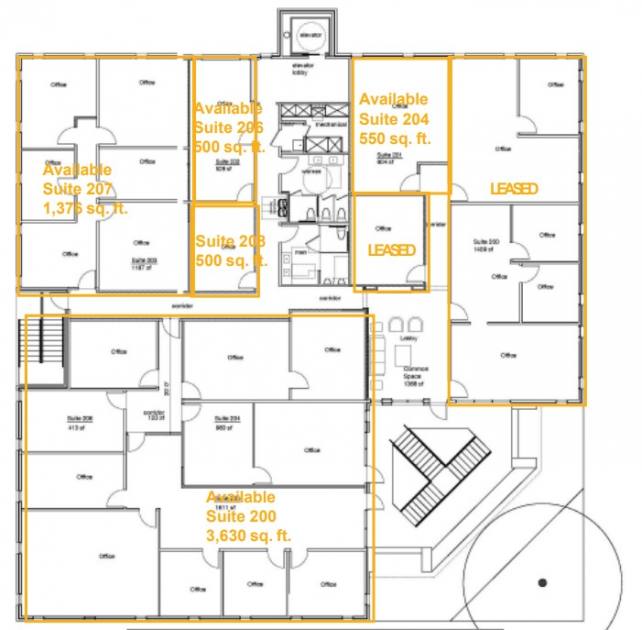
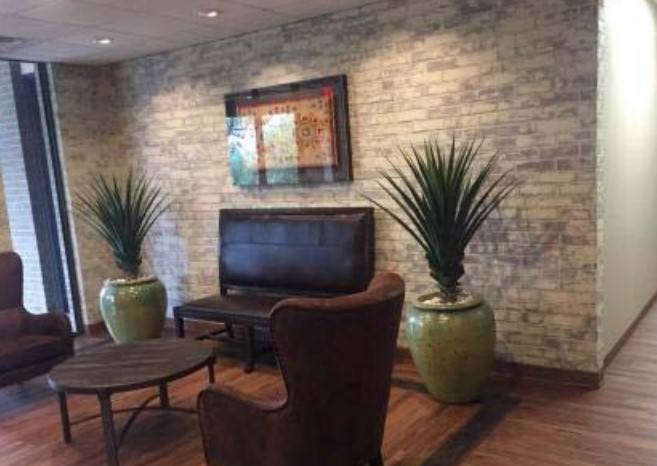
Additional Photos

Listing Agents

Robert Hemphill
O: 512-474-2224
robertrhemphill@austin.rr.com
O: 512-474-2224
robertrhemphill@austin.rr.com
While we strive to provide the most accurate information, all listing information, and demographic data, is provided by third-parties. As such, MyEListing will not be responsible for the accuracy of the information. It is strongly recommended that you verify all information with the listing agent, and any relevant agencies, prior to making any decisions.