Office Space
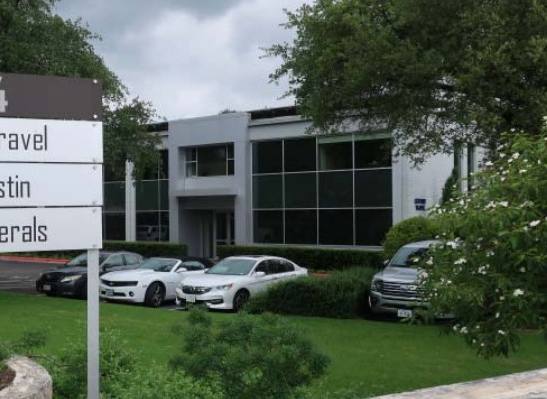
2714 Bee Caves Road Austin, TX 78746
2714 Bee Caves Road Austin, TX 78746
Details & Description
Property Highlights
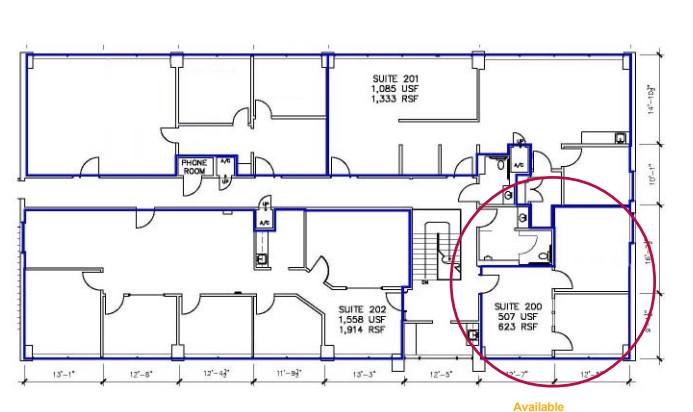
- • Availability: Immediate
- • Size: Suite 200 is 623 Sq. Ft.
- • Parking: 4 spaces per 1,000 square feet leased.
Listing Agents

Robert Hemphill
O: 512-474-2224
robertrhemphill@austin.rr.com
O: 512-474-2224
robertrhemphill@austin.rr.com
While we strive to provide the most accurate information, all listing information, and demographic data, is provided by third-parties. As such, MyEListing will not be responsible for the accuracy of the information. It is strongly recommended that you verify all information with the listing agent, and any relevant agencies, prior to making any decisions.