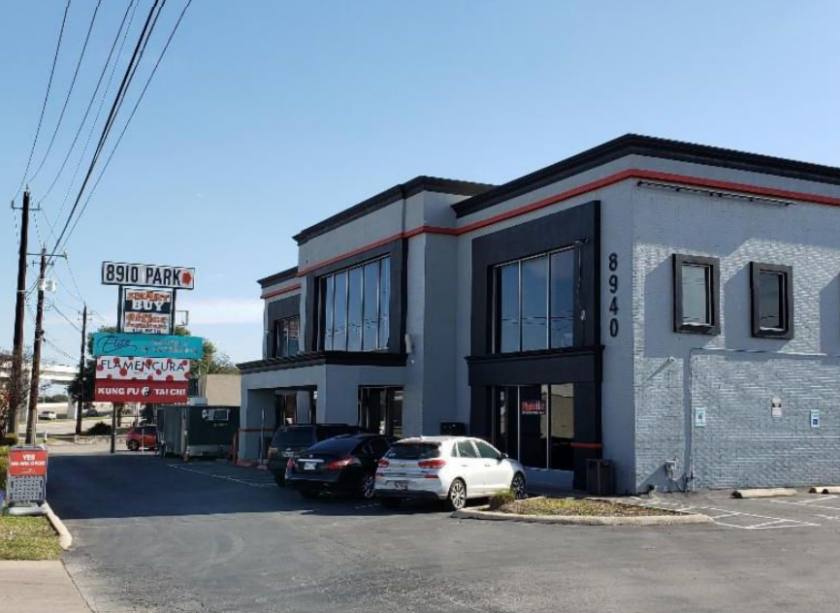
Office Space
8940 Research Boulevard Austin, TX 78757
8940 Research Boulevard Austin, TX 78757
Details & Description
Property Highlights
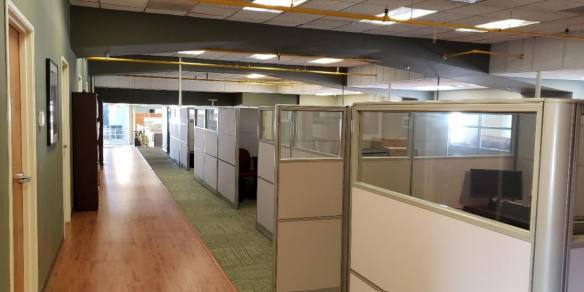
- • 12 hard wall offices and 16 modular work stations
- • Conference room, break room, computer room
- • 15 to 20 parking spaces
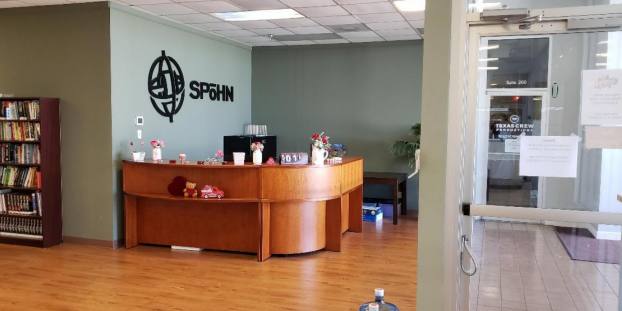
Additional Photos

Listing Agents

Chris Oddo
O: 512-736-5933
oddo@toweratx.com
O: 512-736-5933
oddo@toweratx.com
While we strive to provide the most accurate information, all listing information, and demographic data, is provided by third-parties. As such, MyEListing will not be responsible for the accuracy of the information. It is strongly recommended that you verify all information with the listing agent, and any relevant agencies, prior to making any decisions.


