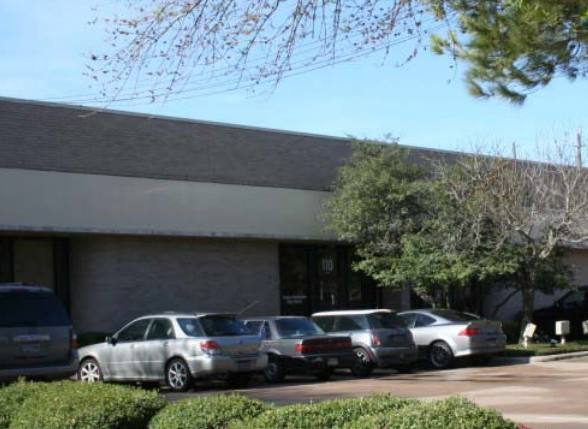
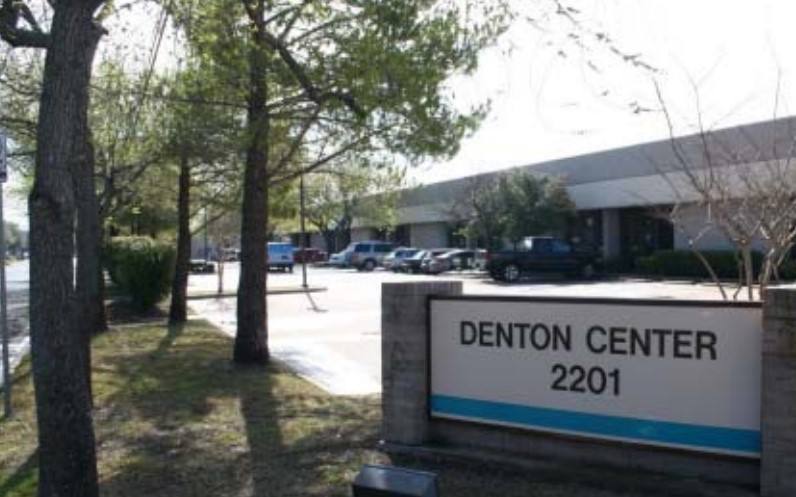
Office Space
2201 Denton Drive Austin, TX 78758
2201 Denton Drive Austin, TX 78758
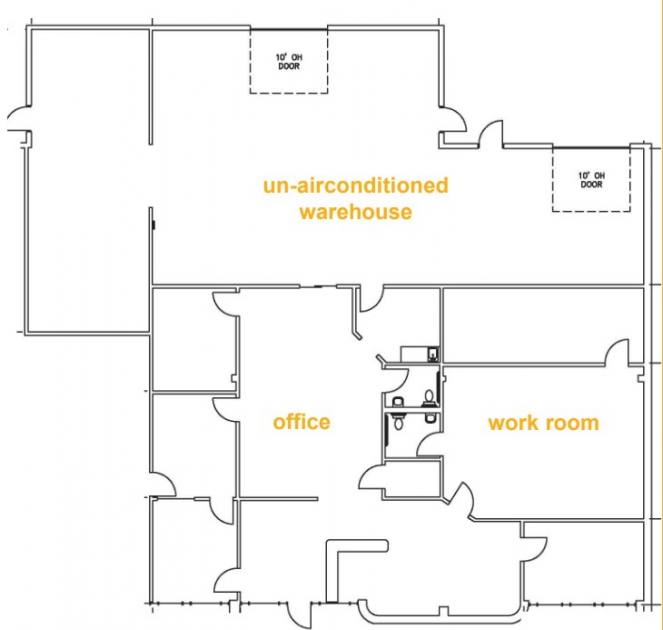
Details & Description
Property Highlights
- • Availability: September 1, 2019
- • Location: North Austin, Braker/Mopac area
- • Clear Height: fourteen feet
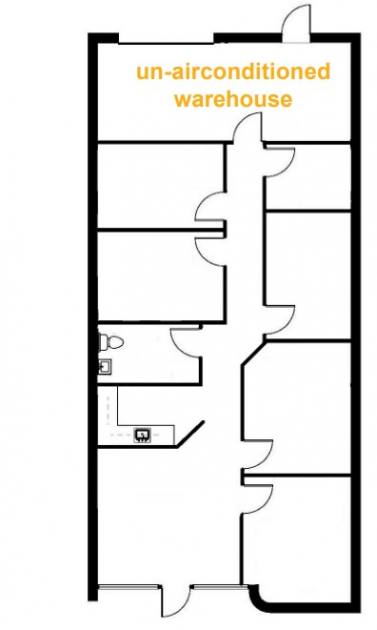
Additional Photos
Listing Agents

Robert Hemphill
O: 512-474-2224
robertrhemphill@austin.rr.com
O: 512-474-2224
robertrhemphill@austin.rr.com
While we strive to provide the most accurate information, all listing information, and demographic data, is provided by third-parties. As such, MyEListing will not be responsible for the accuracy of the information. It is strongly recommended that you verify all information with the listing agent, and any relevant agencies, prior to making any decisions.


