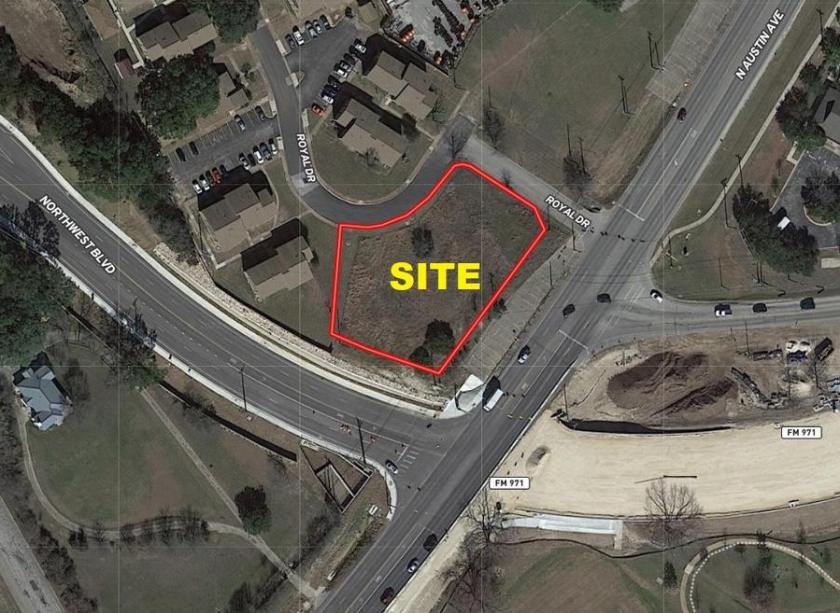
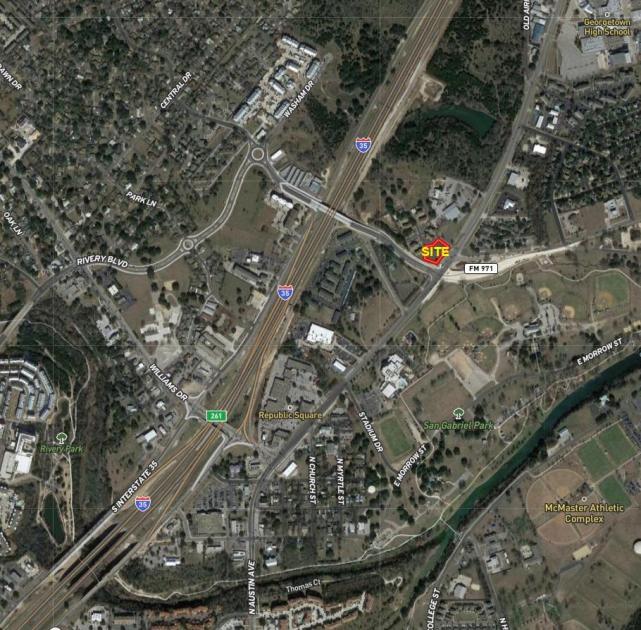
Commercial Land
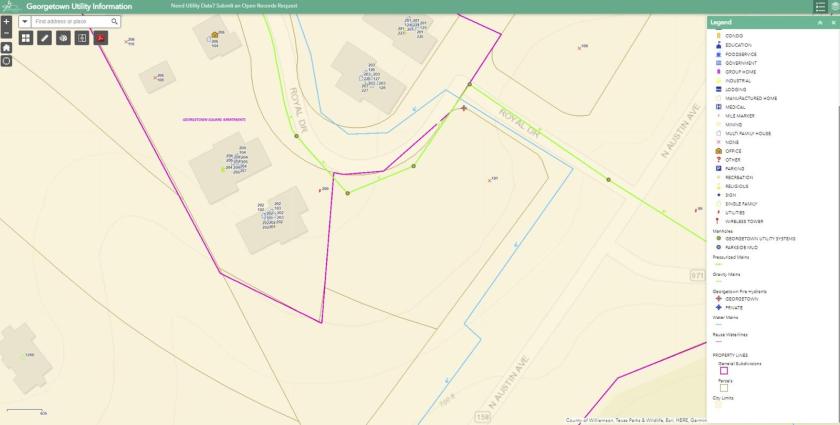
101 Royal Drive Georgetown, TX 78626
101 Royal Drive Georgetown, TX 78626
Details & Description
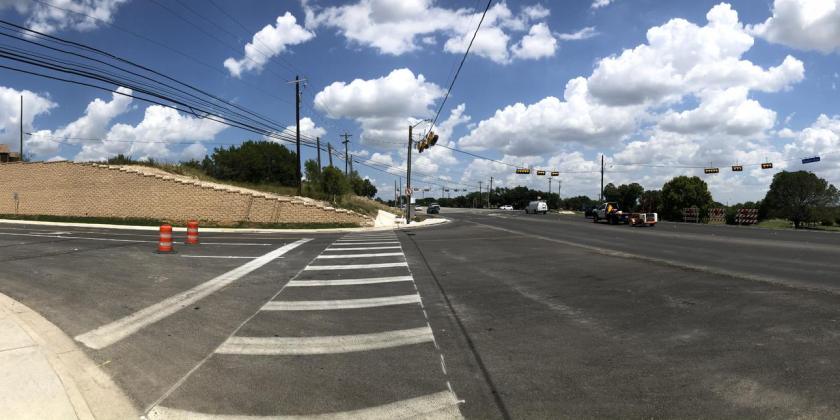
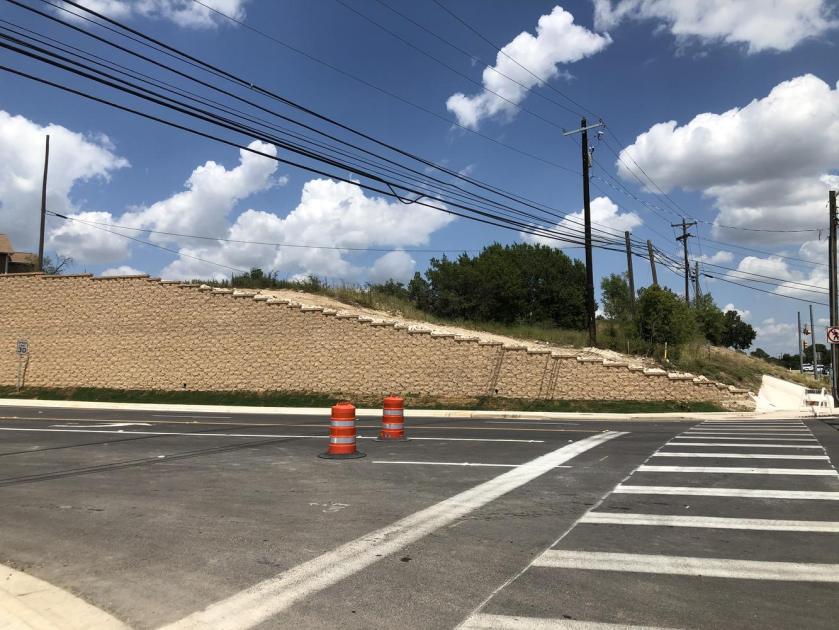
Additional Photos
Listing Agents

Mason Turner
O: 512-930-2800
mason@turnerprop.com
O: 512-930-2800
mason@turnerprop.com
While we strive to provide the most accurate information, all listing information, and demographic data, is provided by third-parties. As such, MyEListing will not be responsible for the accuracy of the information. It is strongly recommended that you verify all information with the listing agent, and any relevant agencies, prior to making any decisions.


