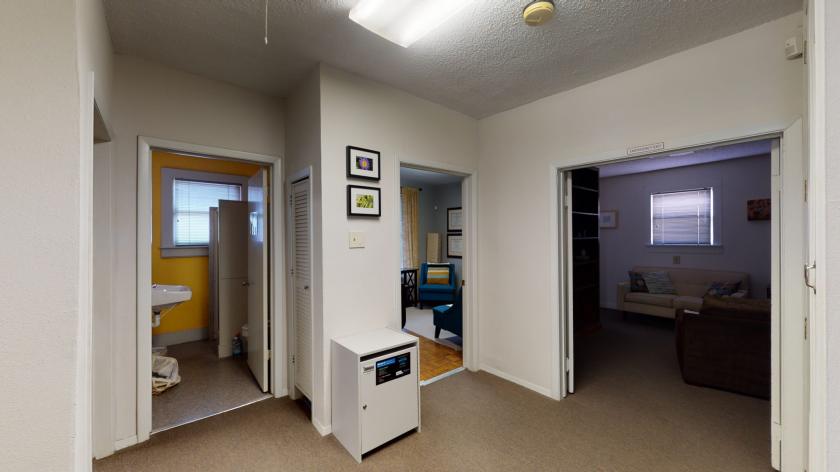
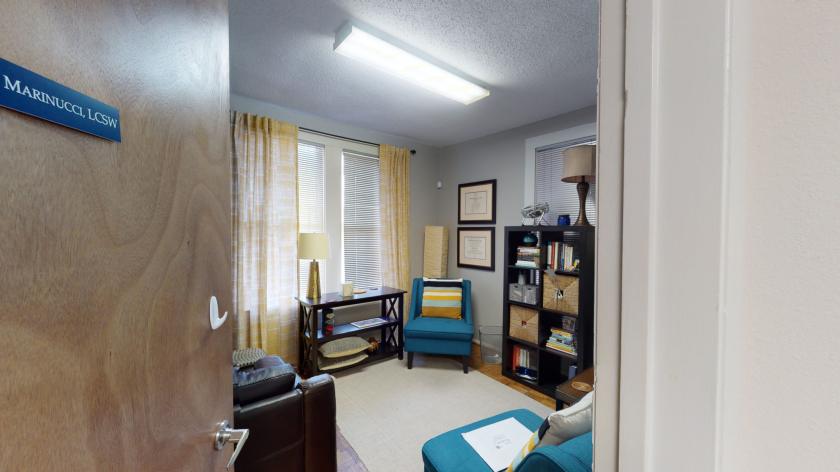
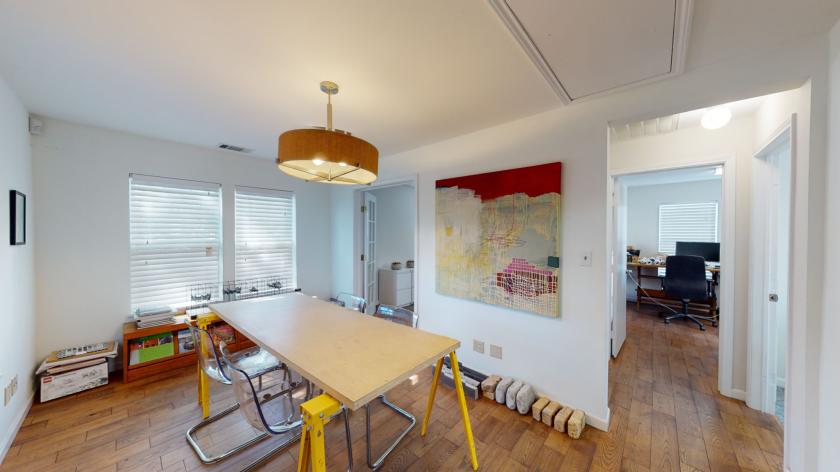
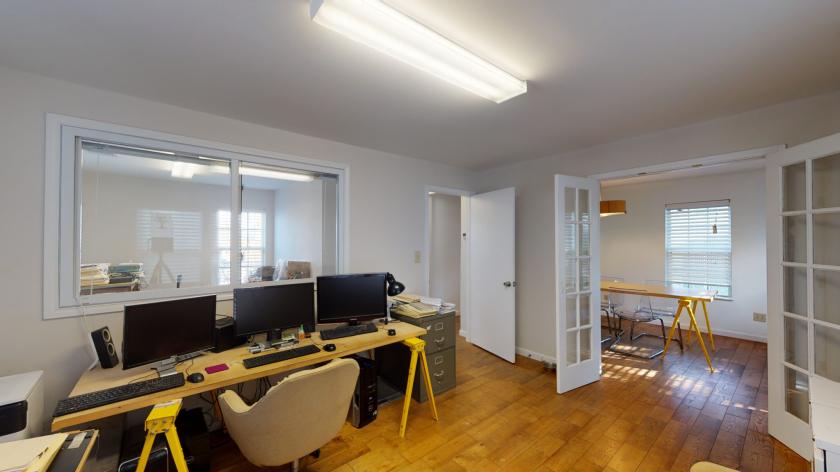
Office Space
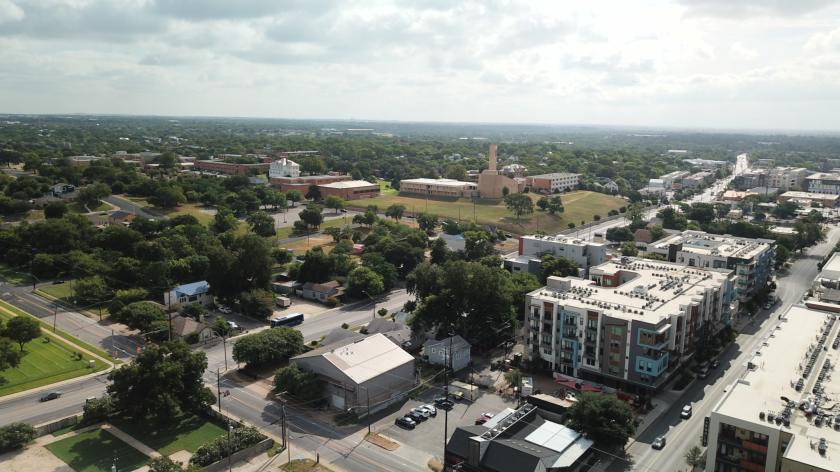
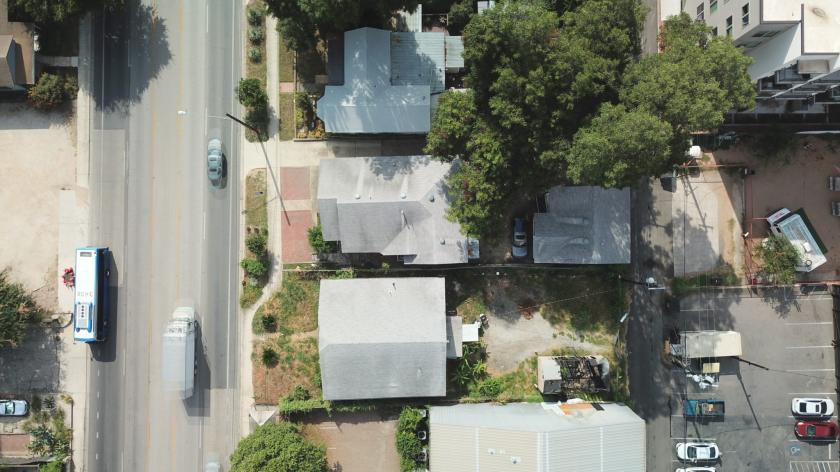
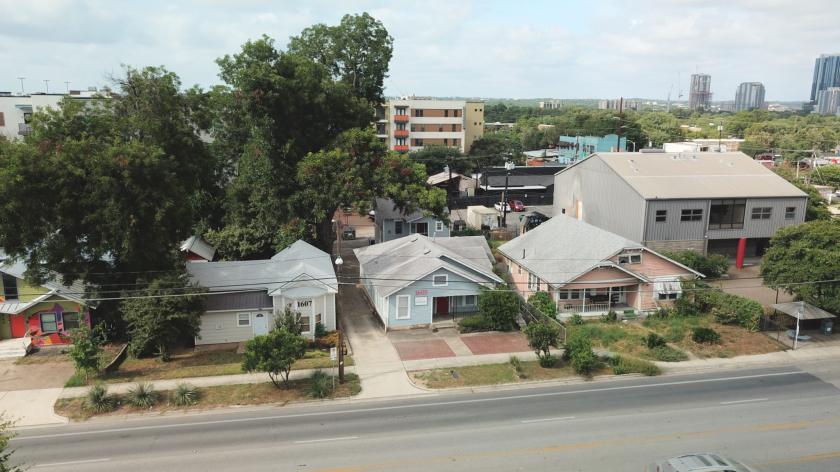
1605 East 7th Street Austin, TX 78702
1605 East 7th Street Austin, TX 78702
Details & Description
Property Highlights
- • Easy Access
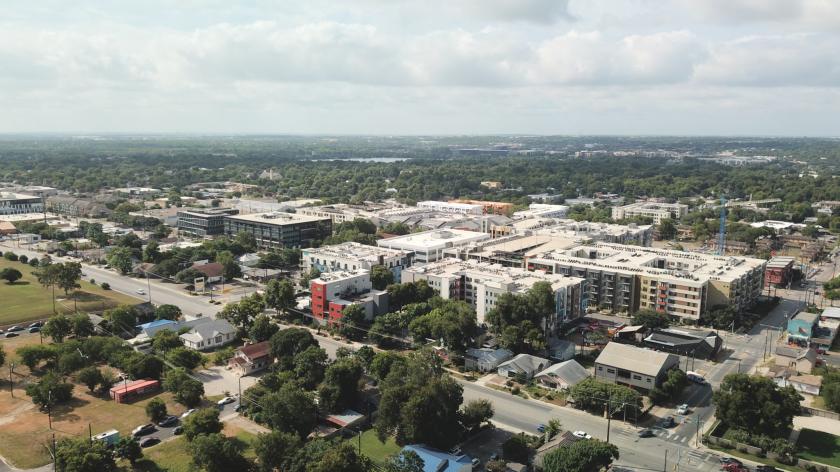
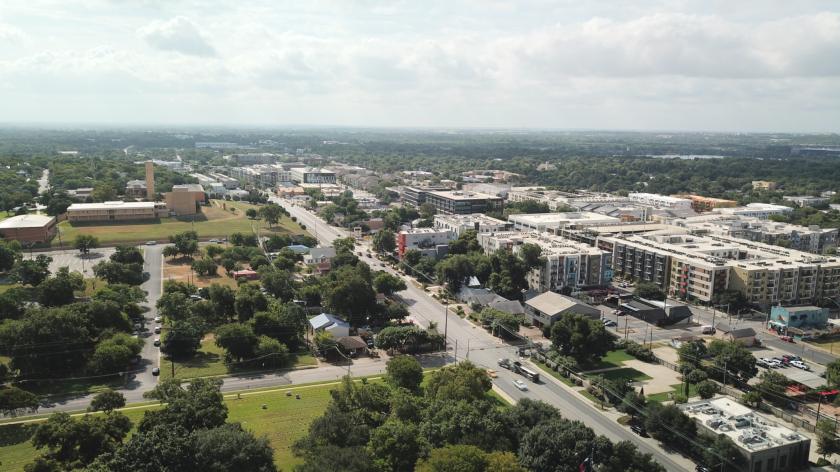
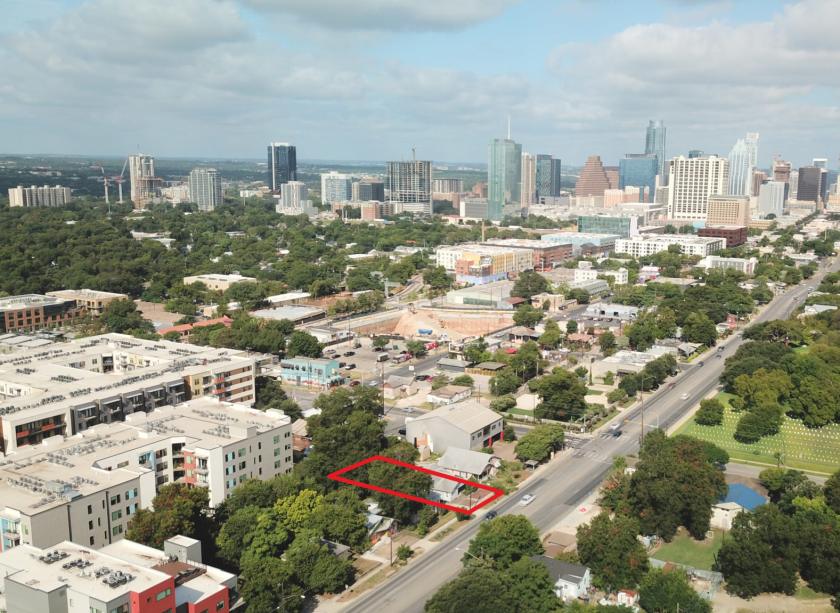
- • Ideally Located Near Downtown
- • Many Nearby Amenities
- • High Visibility Along E 7th Street
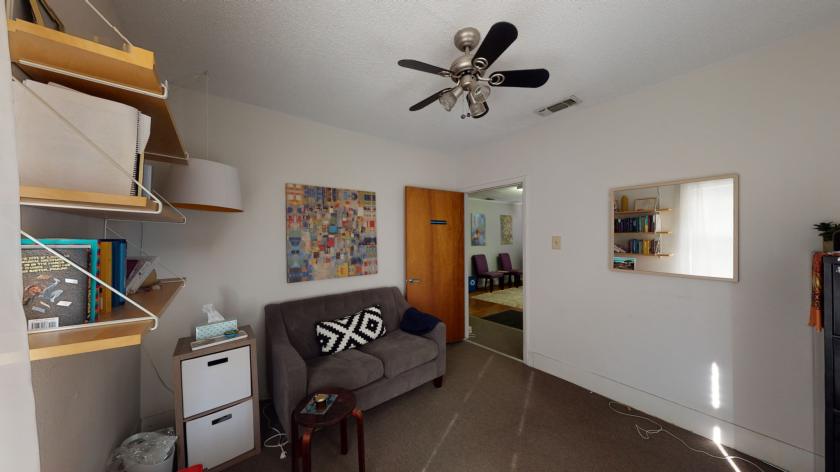
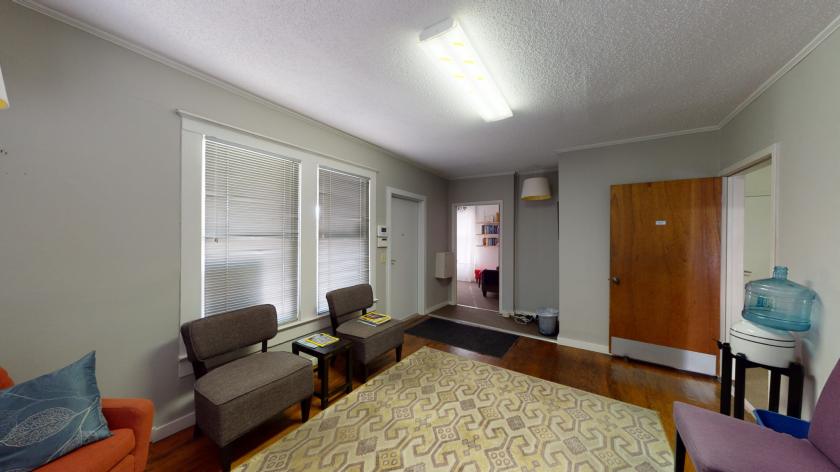
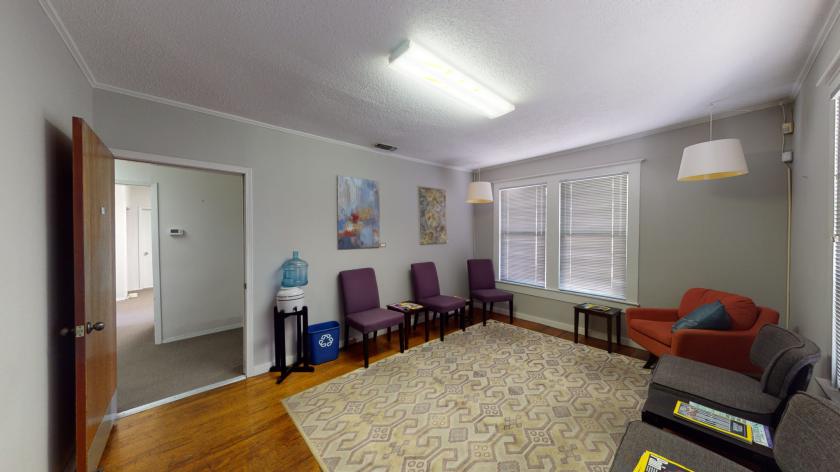
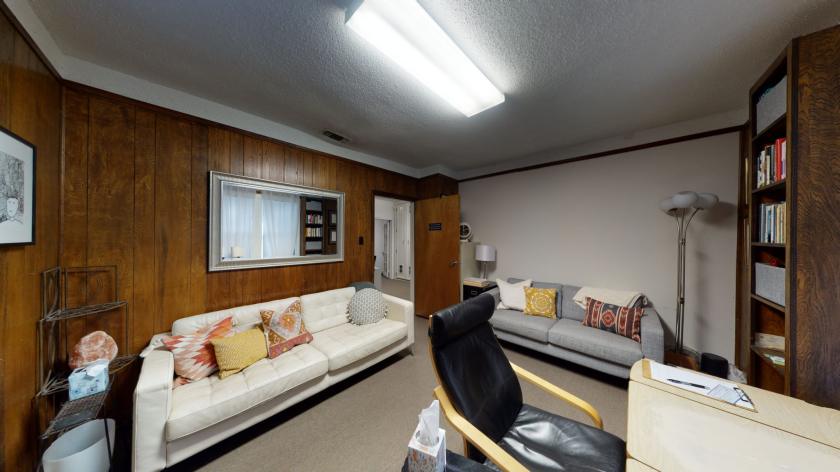
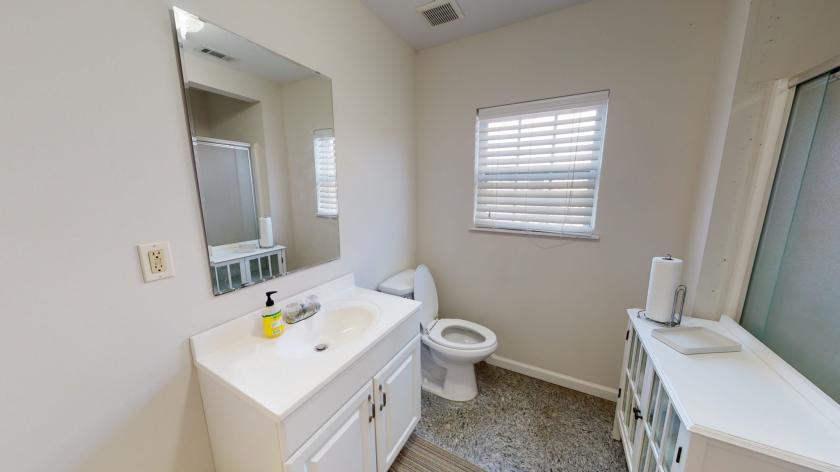
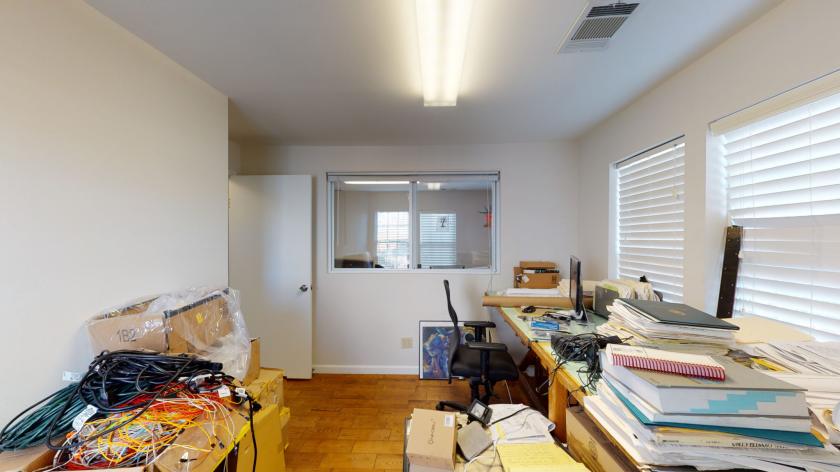
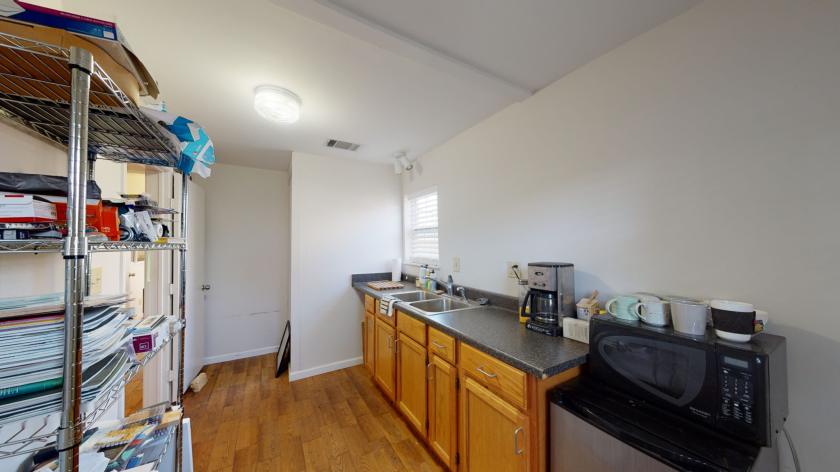
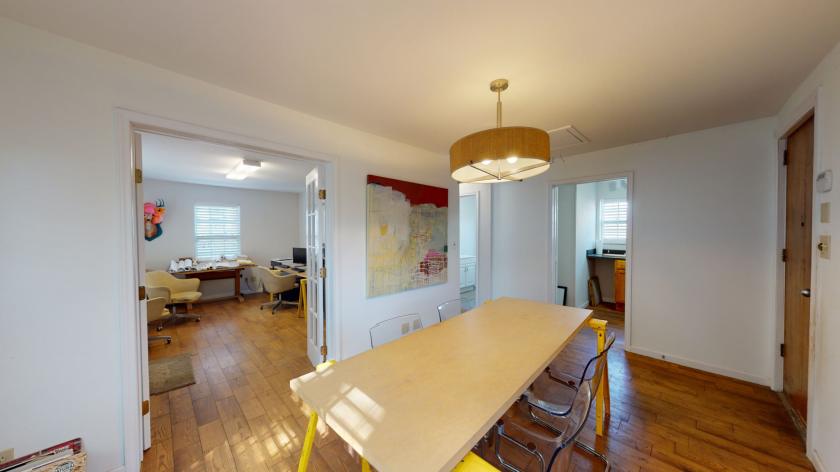
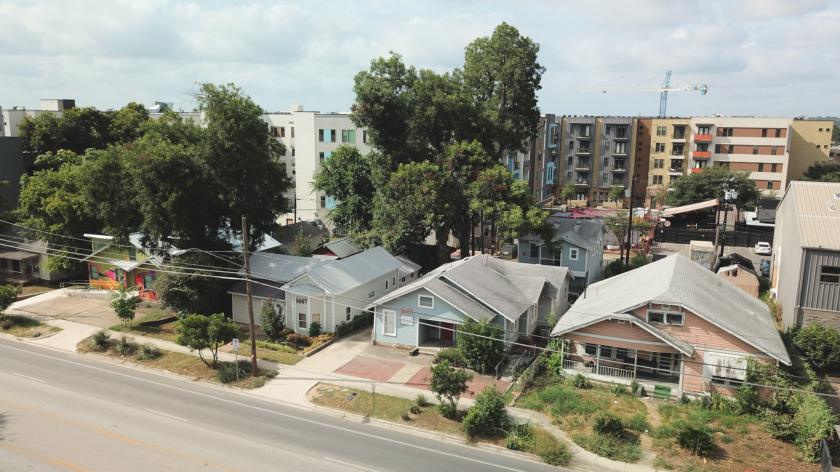
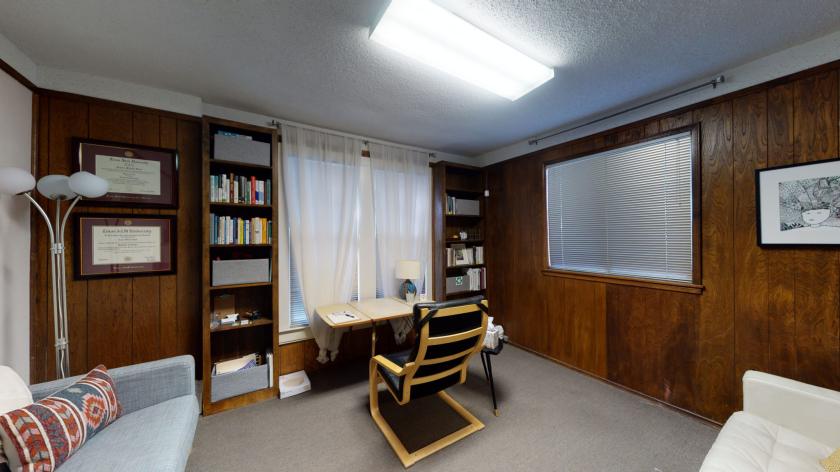
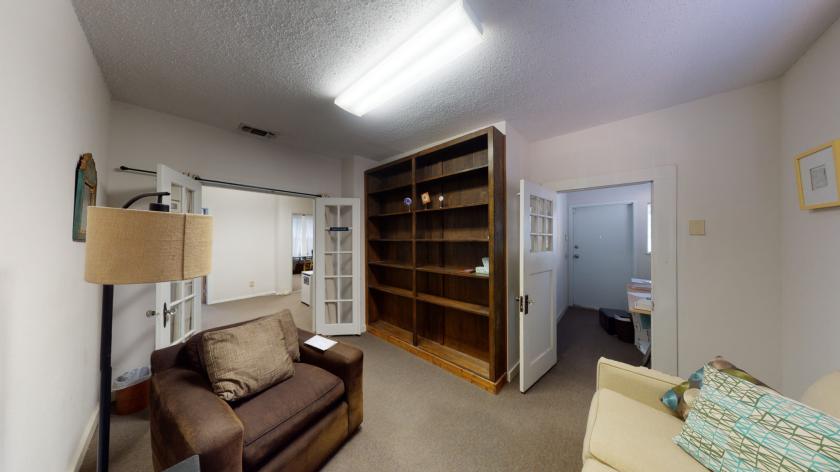
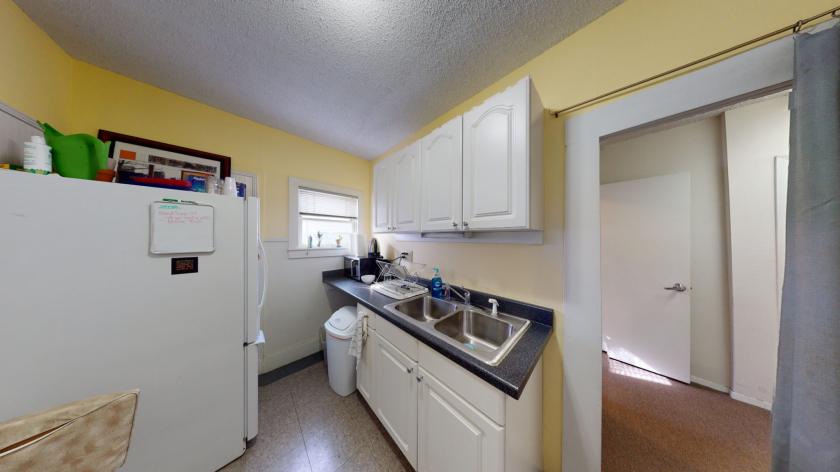
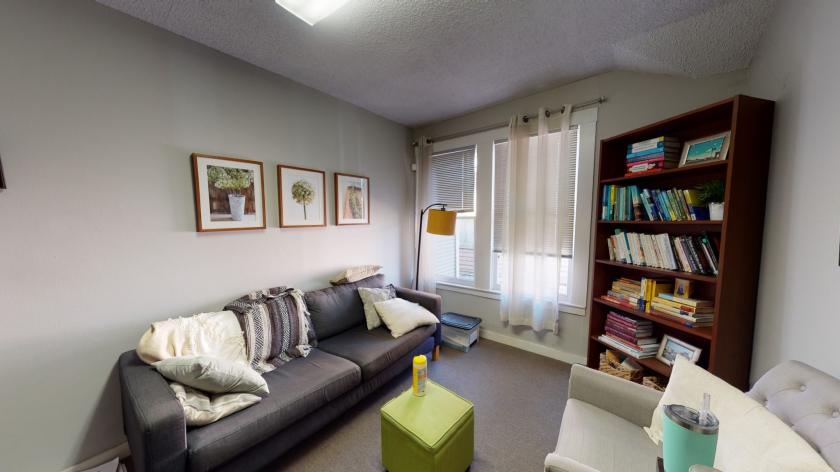
Additional Photos
Listing Agents

Matt Rester
Asterra Properties
O: 512-750-8270
mrester@asterra.com
Asterra Properties
O: 512-750-8270
mrester@asterra.com

Andrew Karr
O: 512-961-1883
akarr@asterra.com
O: 512-961-1883
akarr@asterra.com
While we strive to provide the most accurate information, all listing information, and demographic data, is provided by third-parties. As such, MyEListing will not be responsible for the accuracy of the information. It is strongly recommended that you verify all information with the listing agent, and any relevant agencies, prior to making any decisions.