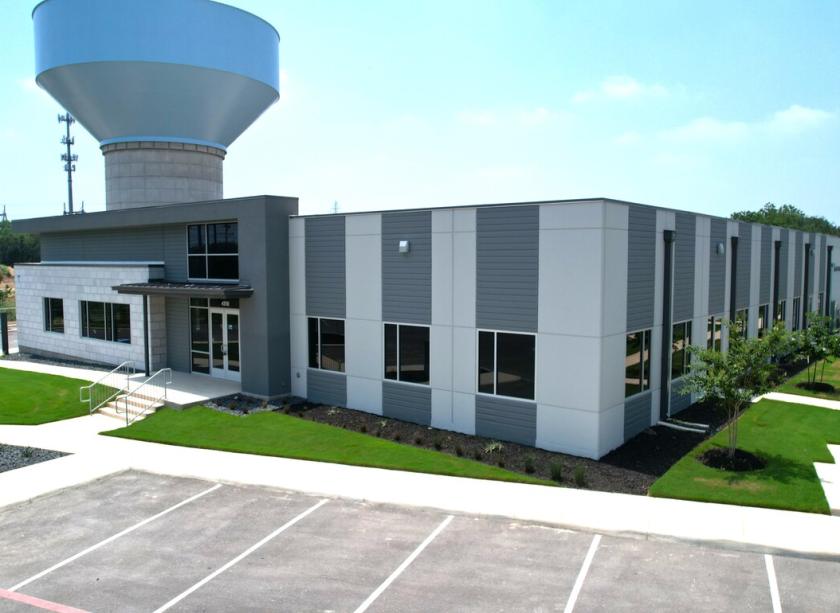
Office Space
4306 and 4318 De Zavala Rd San Antonio, TX 78249
4306 and 4318 De Zavala Rd San Antonio, TX 78249
Details & Description
Property Highlights
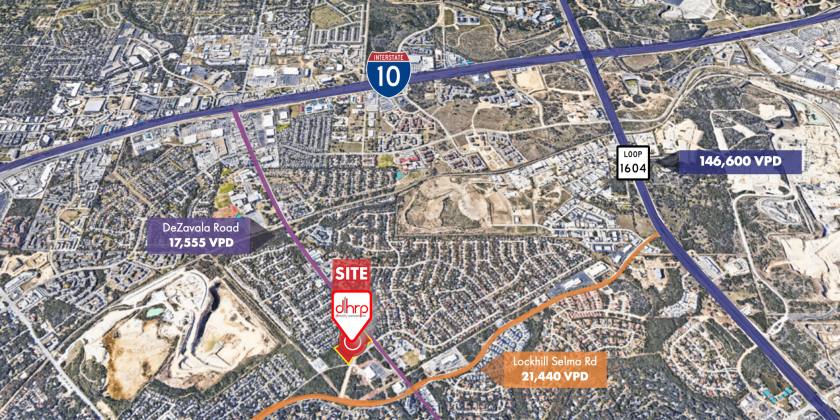
• Property’s proximity to PAM Specialty Hospital of San Antonio, Baptist Emergency Hospital, Methodist Healthcare
• Close proximity to UTSA, Fiesta Texas, The Rim, La Cantera, Topgolf, and iFly.
Additional Photos


Listing Agents

Michael Hoover
O: 210-222-2424
M: 210-218-9095
hoover@dhrp.us
O: 210-222-2424
M: 210-218-9095
hoover@dhrp.us

Alex Yount
O: 210-222-2424
ayount@dhrp.us
O: 210-222-2424
ayount@dhrp.us
While we strive to provide the most accurate information, all listing information, and demographic data, is provided by third-parties. As such, MyEListing will not be responsible for the accuracy of the information. It is strongly recommended that you verify all information with the listing agent, and any relevant agencies, prior to making any decisions.


