Commercial Land
Bastrop 75 Hotel Development Site Bastrop, TX 78602
Bastrop 75 Hotel Development Site Bastrop, TX 78602
Details & Description
Property Highlights
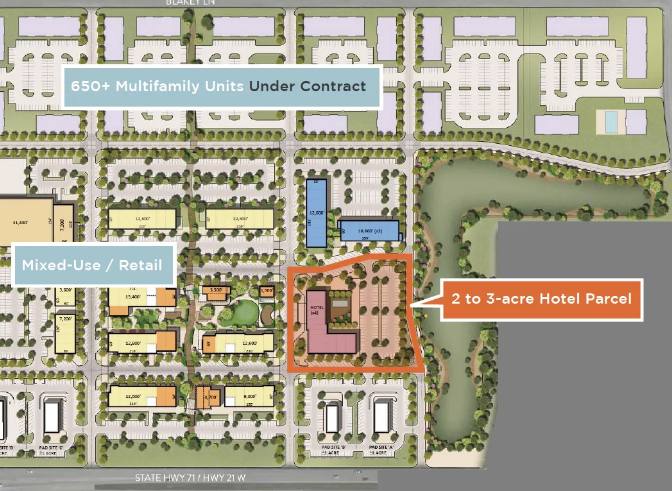
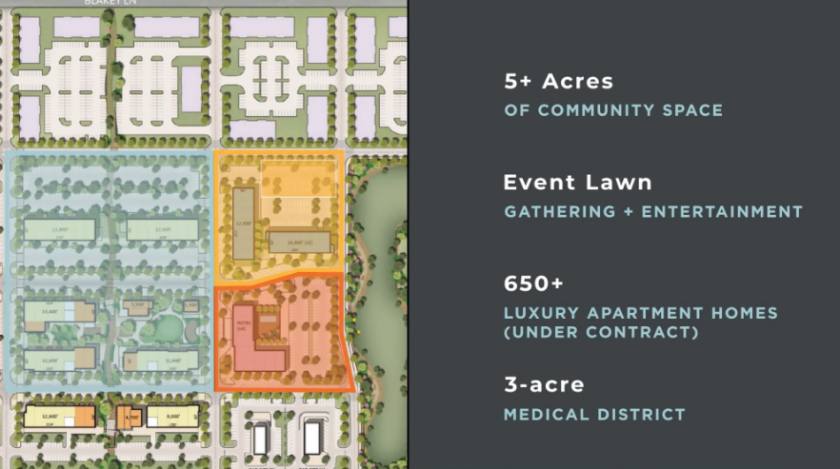
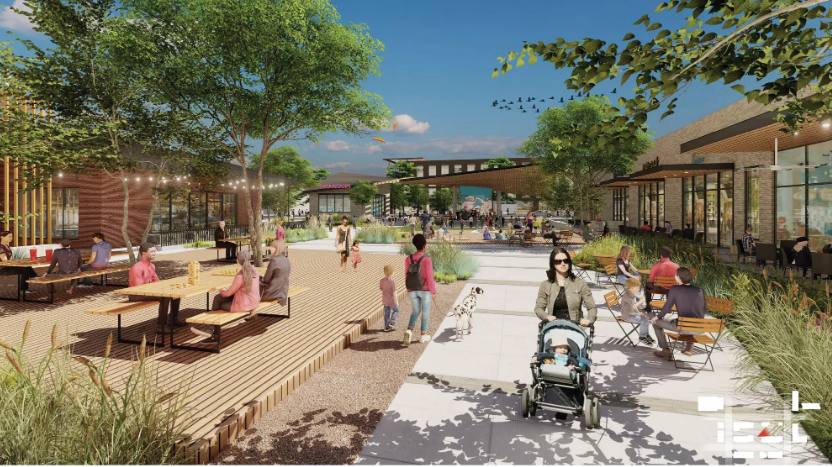
- • 2 to 3-acre lifestyle hotel development parcel
- • Regional detention + water quality
- • Seller to bring all utilities to the site
- • View video here: https://vimeo.com/712139909
Additional Photos
Listing Agents

John T. Baird
O: 512-474-2411
M: 512-717-3085
john.baird@avisonyoung.com
O: 512-474-2411
M: 512-717-3085
john.baird@avisonyoung.com
While we strive to provide the most accurate information, all listing information, and demographic data, is provided by third-parties. As such, MyEListing will not be responsible for the accuracy of the information. It is strongly recommended that you verify all information with the listing agent, and any relevant agencies, prior to making any decisions.


