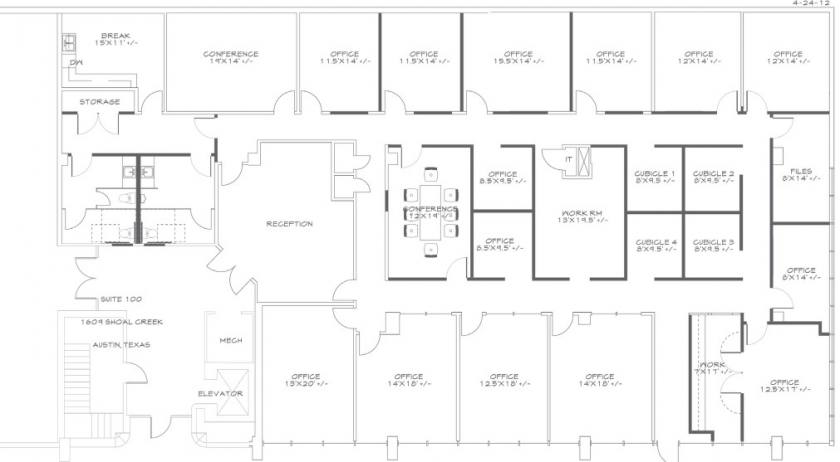
Office Space
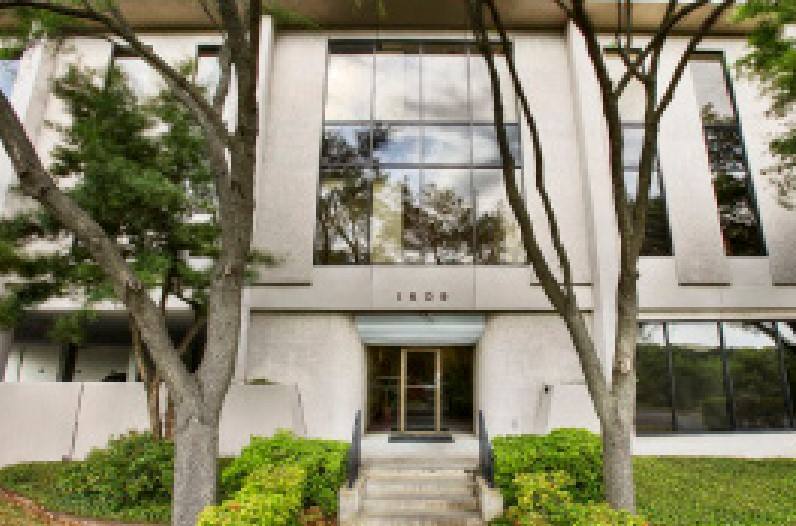
1609 Shoal Creek Boulevard Austin, TX 78701
1609 Shoal Creek Boulevard Austin, TX 78701
Details & Description
Property Highlights
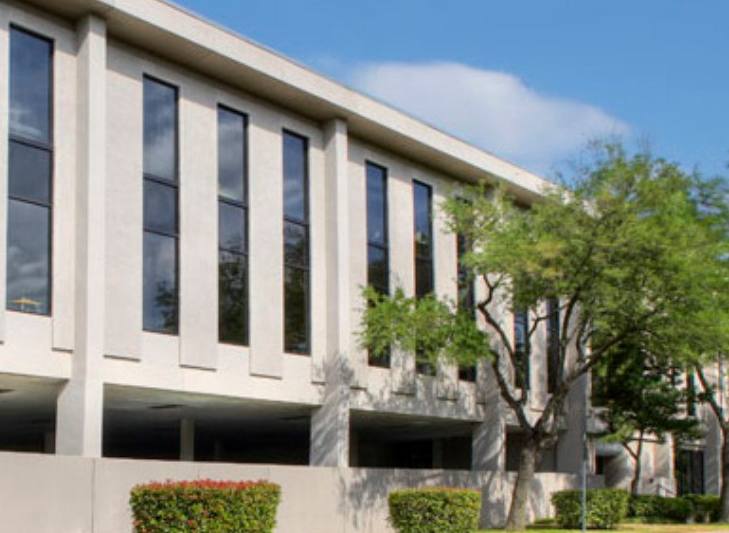
- • Located in the heart of central Austin
- • Great surrounding community demographics
- • Beautiful hill country environment
- • Ample free surface parking front and back
- • Great downtown and Pease Park views
Listing Agents

Brian Novy
O: 512-750-5587
novyco@austin.rr.com
O: 512-750-5587
novyco@austin.rr.com
While we strive to provide the most accurate information, all listing information, and demographic data, is provided by third-parties. As such, MyEListing will not be responsible for the accuracy of the information. It is strongly recommended that you verify all information with the listing agent, and any relevant agencies, prior to making any decisions.