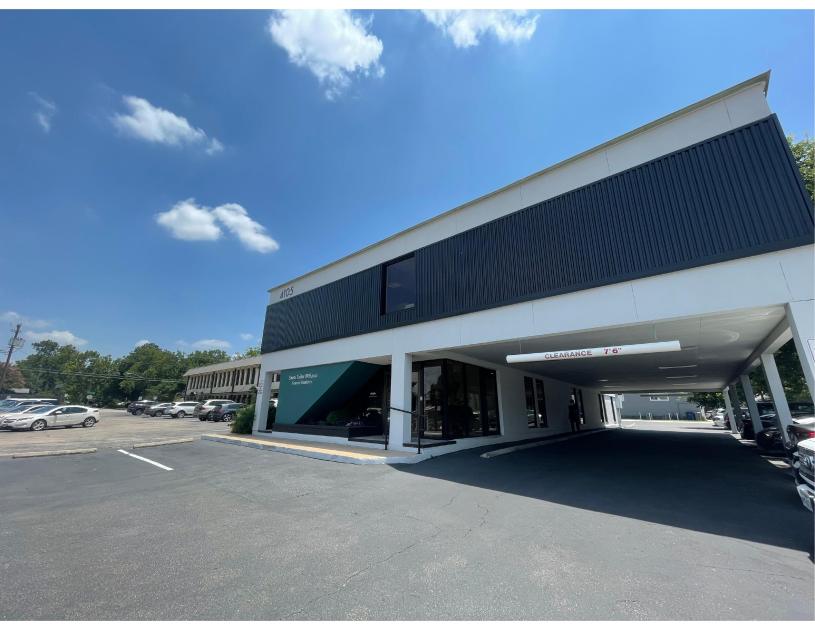
Office Space
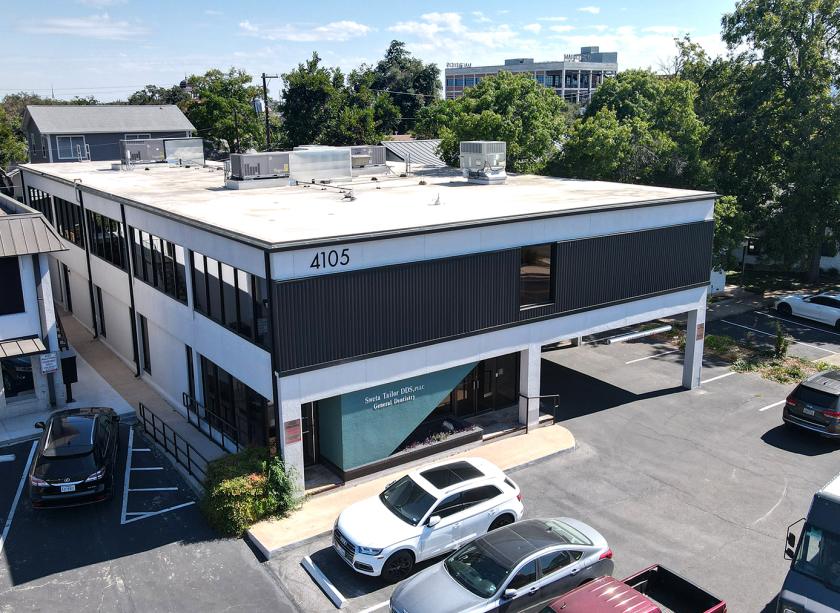
4105 Medical Parkway Austin, TX 78756
4105 Medical Parkway Austin, TX 78756
Details & Description
Property Highlights
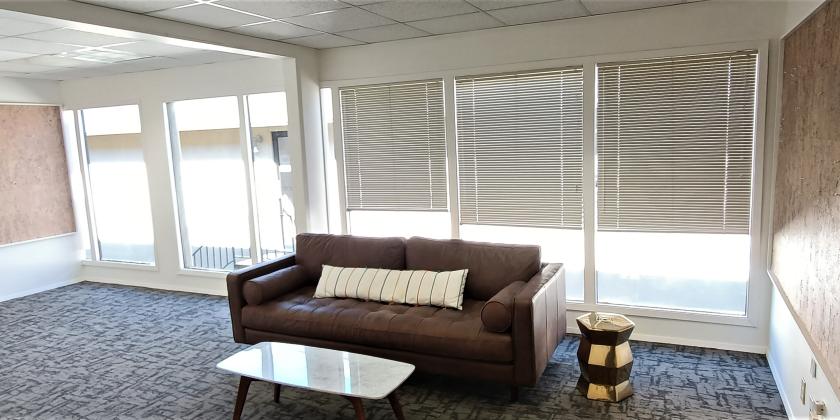
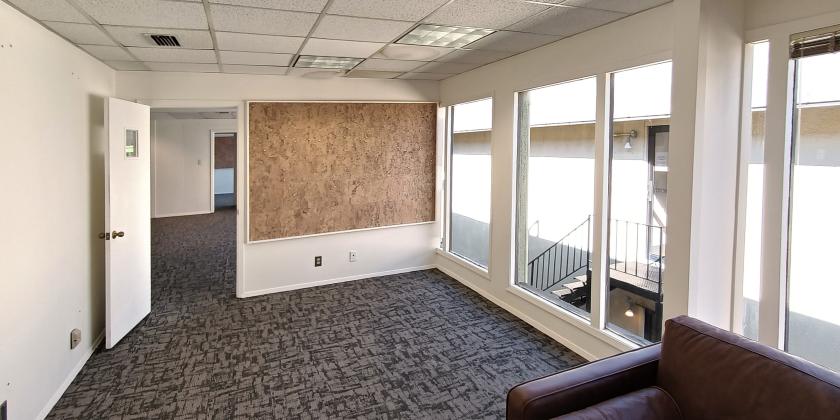
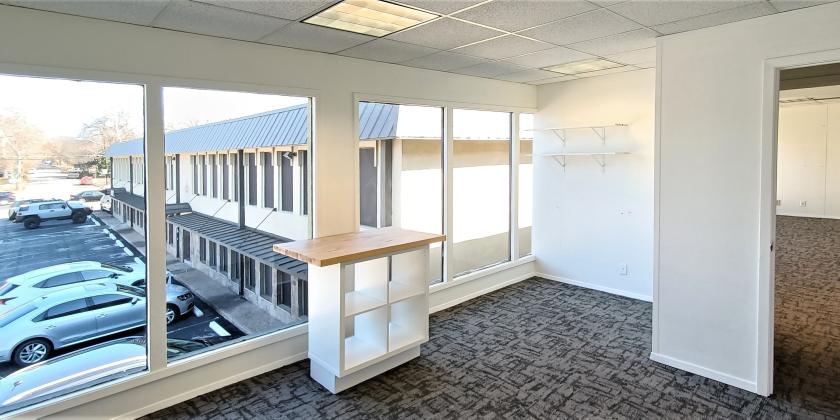
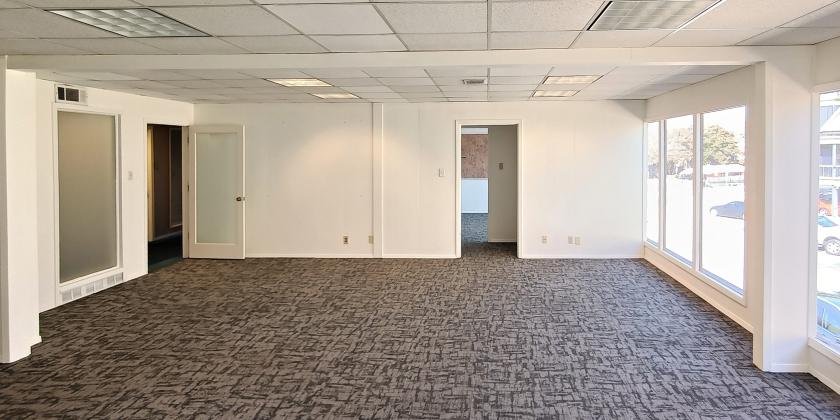
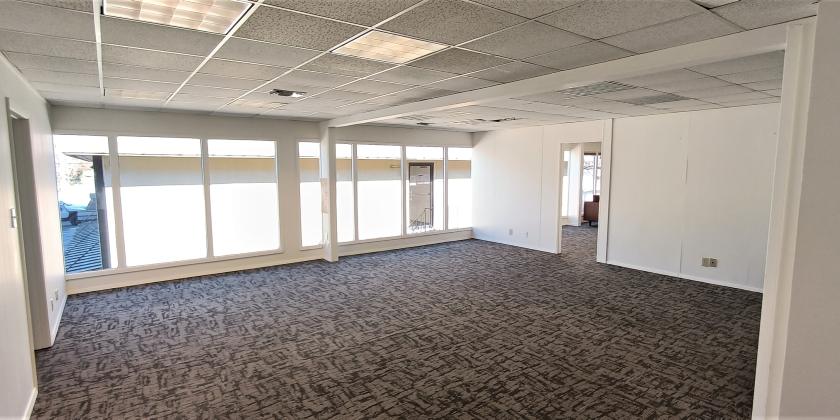
- • New carpeting and windows through out
- • Great Natural Lighting
- • Flexible Floor Plan
- • Building owner on site
- • Lease rate does not include internet
Additional Photos
Listing Agents

Evan Bole
O: 512-682-1017
M: 512-277-0078
evan@cipaustin.com
O: 512-682-1017
M: 512-277-0078
evan@cipaustin.com

Bob Springer
O: 512-682-1001
M: 512-682-1001
bob@cipaustin.com
O: 512-682-1001
M: 512-682-1001
bob@cipaustin.com
While we strive to provide the most accurate information, all listing information, and demographic data, is provided by third-parties. As such, MyEListing will not be responsible for the accuracy of the information. It is strongly recommended that you verify all information with the listing agent, and any relevant agencies, prior to making any decisions.