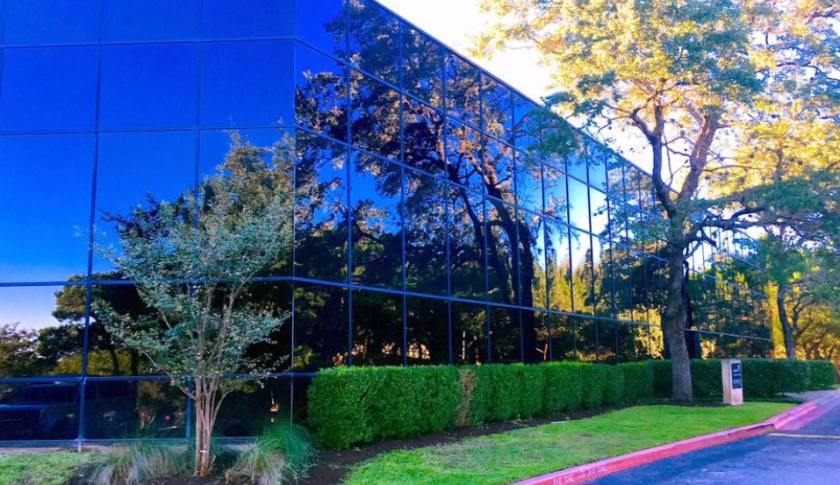
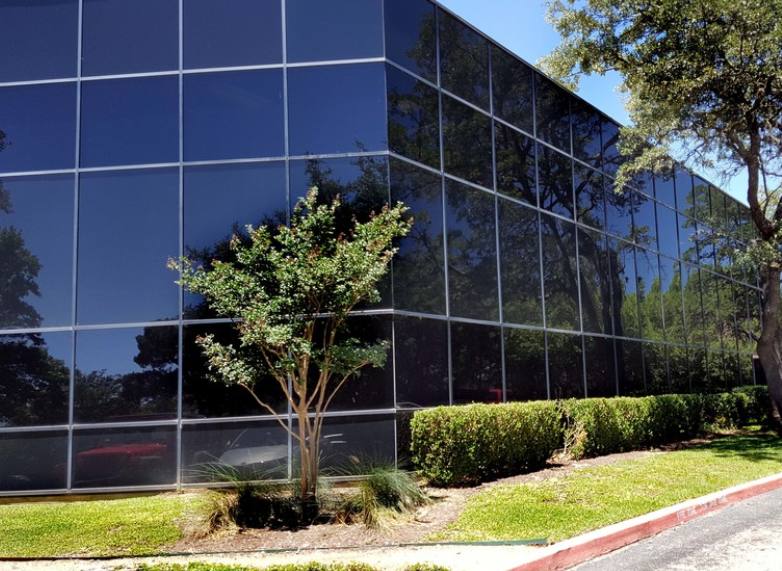
Office Space
1101 North Capital of Texas Highway Austin, TX 78746
1101 North Capital of Texas Highway Austin, TX 78746
Details & Description
Property Highlights
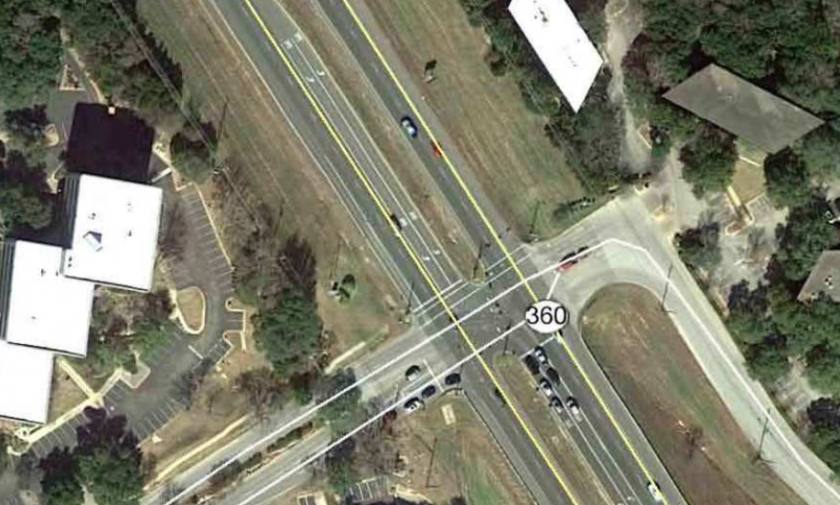
• Easy access from Capitol of Texas Hwy. (Loop 360), located next to the Lost Creek intersection.
• Year Built: 1982
Listing Agents

Joe McAllister
O: 512-536-7808
M: 512-784-1134
joewillie@matexas.com
O: 512-536-7808
M: 512-784-1134
joewillie@matexas.com
While we strive to provide the most accurate information, all listing information, and demographic data, is provided by third-parties. As such, MyEListing will not be responsible for the accuracy of the information. It is strongly recommended that you verify all information with the listing agent, and any relevant agencies, prior to making any decisions.