Industrial Properties
3323 South Farm-to-Market 565 Road Baytown, TX 77523
3323 South Farm-to-Market 565 Road Baytown, TX 77523

Details & Description
Property Highlights
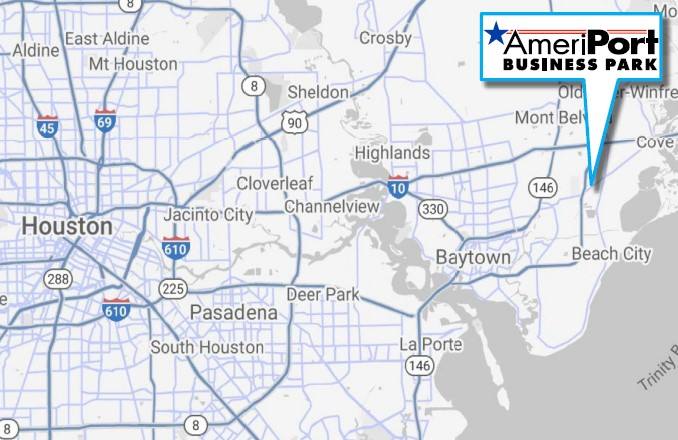
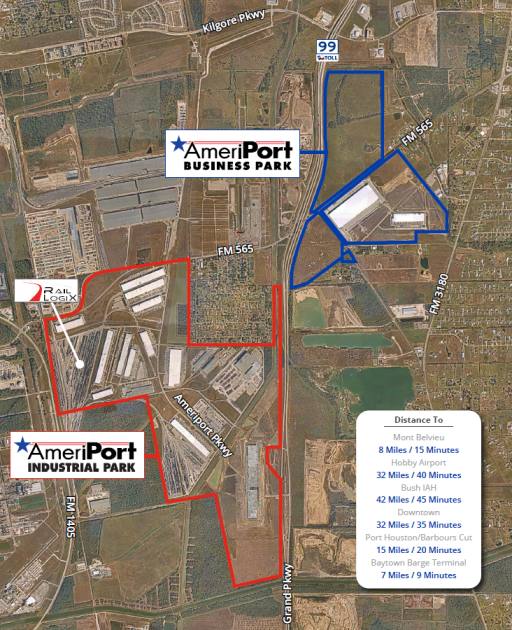
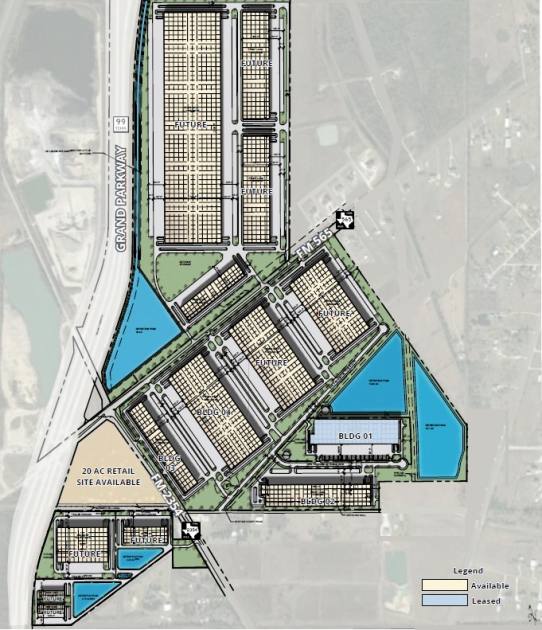
• The location offers superior connectivity to, through, and around the Greater Houston metroplex
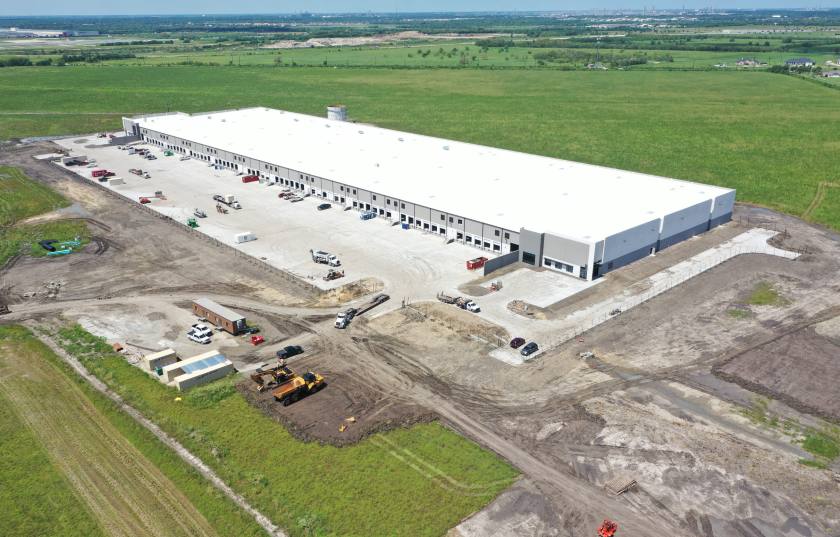
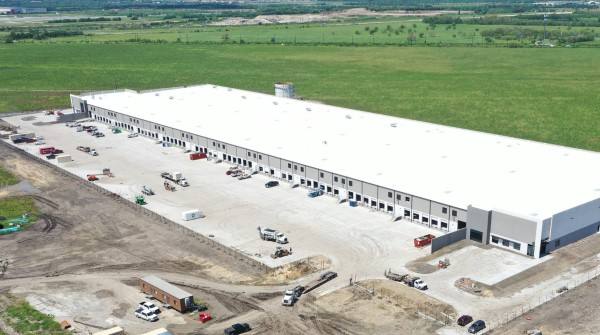
• Building Size 1,855,000 SF Total
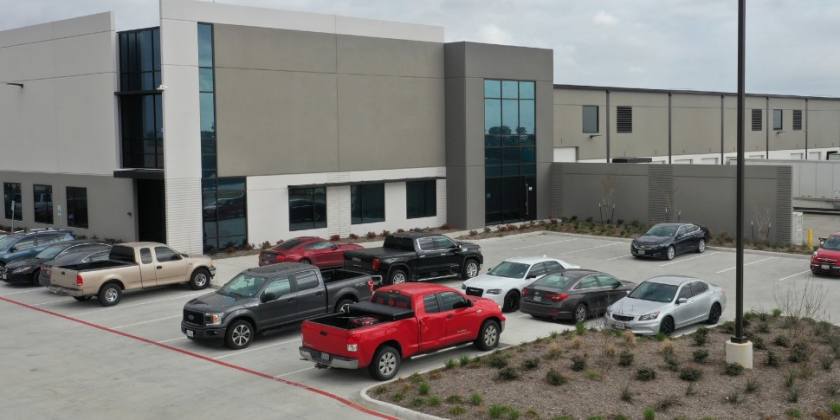
Additional Photos
Listing Agents

Robert Alinger
O: 713-830-2167
M: 713-724-7208
robert.alinger@colliers.com
O: 713-830-2167
M: 713-724-7208
robert.alinger@colliers.com

Wes Williams
O: 713-830-2113
M: 281-636-9535
wes.williams@colliers.com
O: 713-830-2113
M: 281-636-9535
wes.williams@colliers.com
While we strive to provide the most accurate information, all listing information, and demographic data, is provided by third-parties. As such, MyEListing will not be responsible for the accuracy of the information. It is strongly recommended that you verify all information with the listing agent, and any relevant agencies, prior to making any decisions.