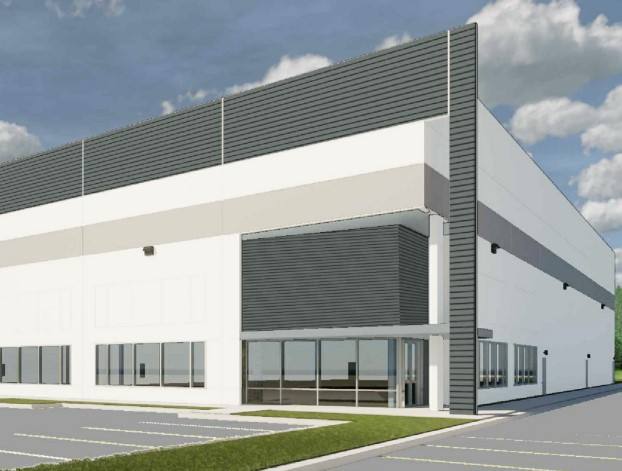
Industrial Properties
S Sam Houston Pkwy W. Houston, TX 77053
S Sam Houston Pkwy W. Houston, TX 77053

Details & Description
Property Highlights
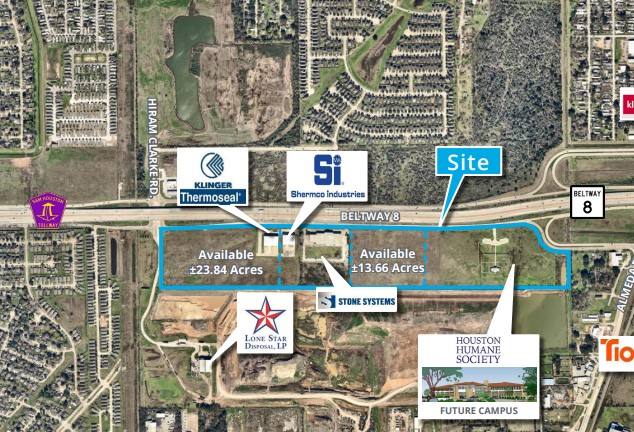
• Immediate access to one of Houston‘s arterial highways on Beltway 8 (Sam Houston Tollway) in close proxim
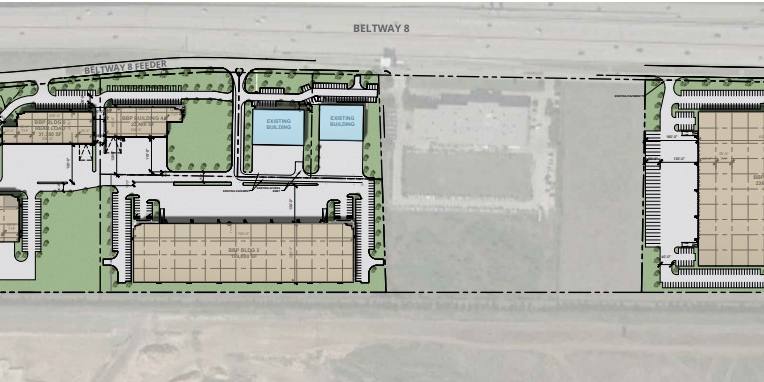
• Beltway Business Park offers immediate access and visibility on Beltway 8
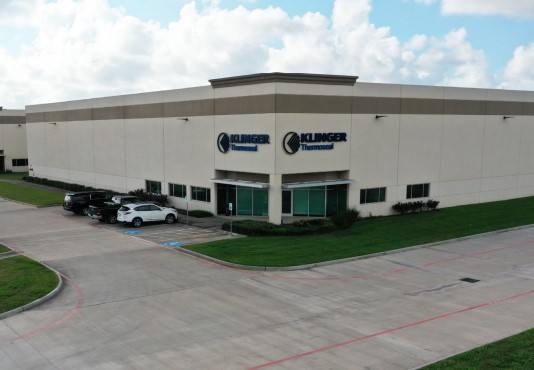
Additional Photos
Listing Agents

Robert Alinger
O: 713-830-2167
M: 713-724-7208
robert.alinger@colliers.com
O: 713-830-2167
M: 713-724-7208
robert.alinger@colliers.com

Wes Williams
O: 713-830-2113
M: 281-636-9535
wes.williams@colliers.com
O: 713-830-2113
M: 281-636-9535
wes.williams@colliers.com
While we strive to provide the most accurate information, all listing information, and demographic data, is provided by third-parties. As such, MyEListing will not be responsible for the accuracy of the information. It is strongly recommended that you verify all information with the listing agent, and any relevant agencies, prior to making any decisions.


