Commercial Land
16335 Peninsula St Houston, TX 77015
16335 Peninsula St Houston, TX 77015
Details & Description
Property Highlights
- • Rail service possible by PTRA
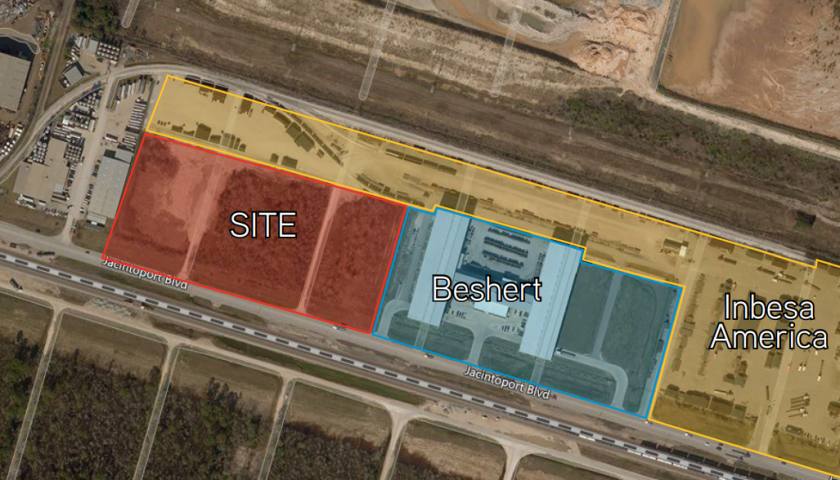
- • Over 990’ of frontage on Jacintoport Blvd.
- • May be subdivided
- • Off-site detention
- • All utilities available
- • Owner/developer can provide turn-key project
Listing Agents

Mike Taetz
O: 713-830-2107
M: 713-446-6777
mike.taetz@colliers.com
O: 713-830-2107
M: 713-446-6777
mike.taetz@colliers.com
While we strive to provide the most accurate information, all listing information, and demographic data, is provided by third-parties. As such, MyEListing will not be responsible for the accuracy of the information. It is strongly recommended that you verify all information with the listing agent, and any relevant agencies, prior to making any decisions.