Office Space
2323 South Shepherd Drive Houston, TX 77019
2323 South Shepherd Drive Houston, TX 77019

Details & Description
Property Highlights
- • Class A, LEED Certified Gold office building
- • Ample parking in 7-story parking garage
- • Parking Ratio: 3.00 / 1,000 SF
- • Sublease Term thru September 30, 2024
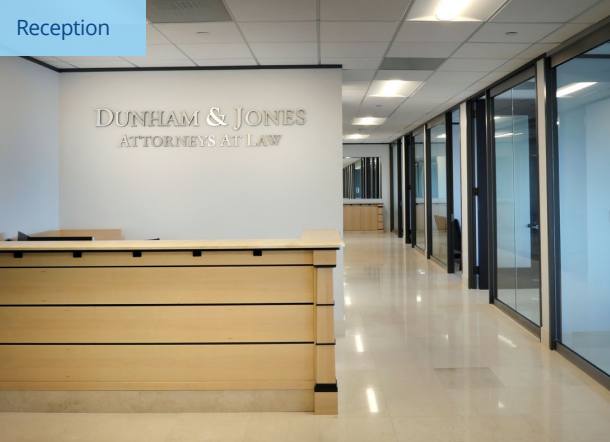
Additional Photos


Listing Agents

Jeff Peltier
O: 713-830-2182
M: 281-827-5922
jeff.peltier@colliers.com
O: 713-830-2182
M: 281-827-5922
jeff.peltier@colliers.com

John Parsley
O: 713-830-2140
M: 281-236-6558
john.parsley@colliers.com
O: 713-830-2140
M: 281-236-6558
john.parsley@colliers.com
While we strive to provide the most accurate information, all listing information, and demographic data, is provided by third-parties. As such, MyEListing will not be responsible for the accuracy of the information. It is strongly recommended that you verify all information with the listing agent, and any relevant agencies, prior to making any decisions.


